One trade
See one trade in full, review it, change it or delete it. Add a trade by hand.
Each trade has its own page. It shows the details, your notes and your tags. From there you can change the trade or delete it. At the end of this page, you learn how to add a trade by hand.
Open a trade
- In HANSEI's menu on the left, click Trades.
- Click the trade's row.
You can also click a trade in the dashboard's Recent Trades card, or in a calendar day.
The trade page
The title shows the symbol, like AAPL Trade. Under it are the date and the side.
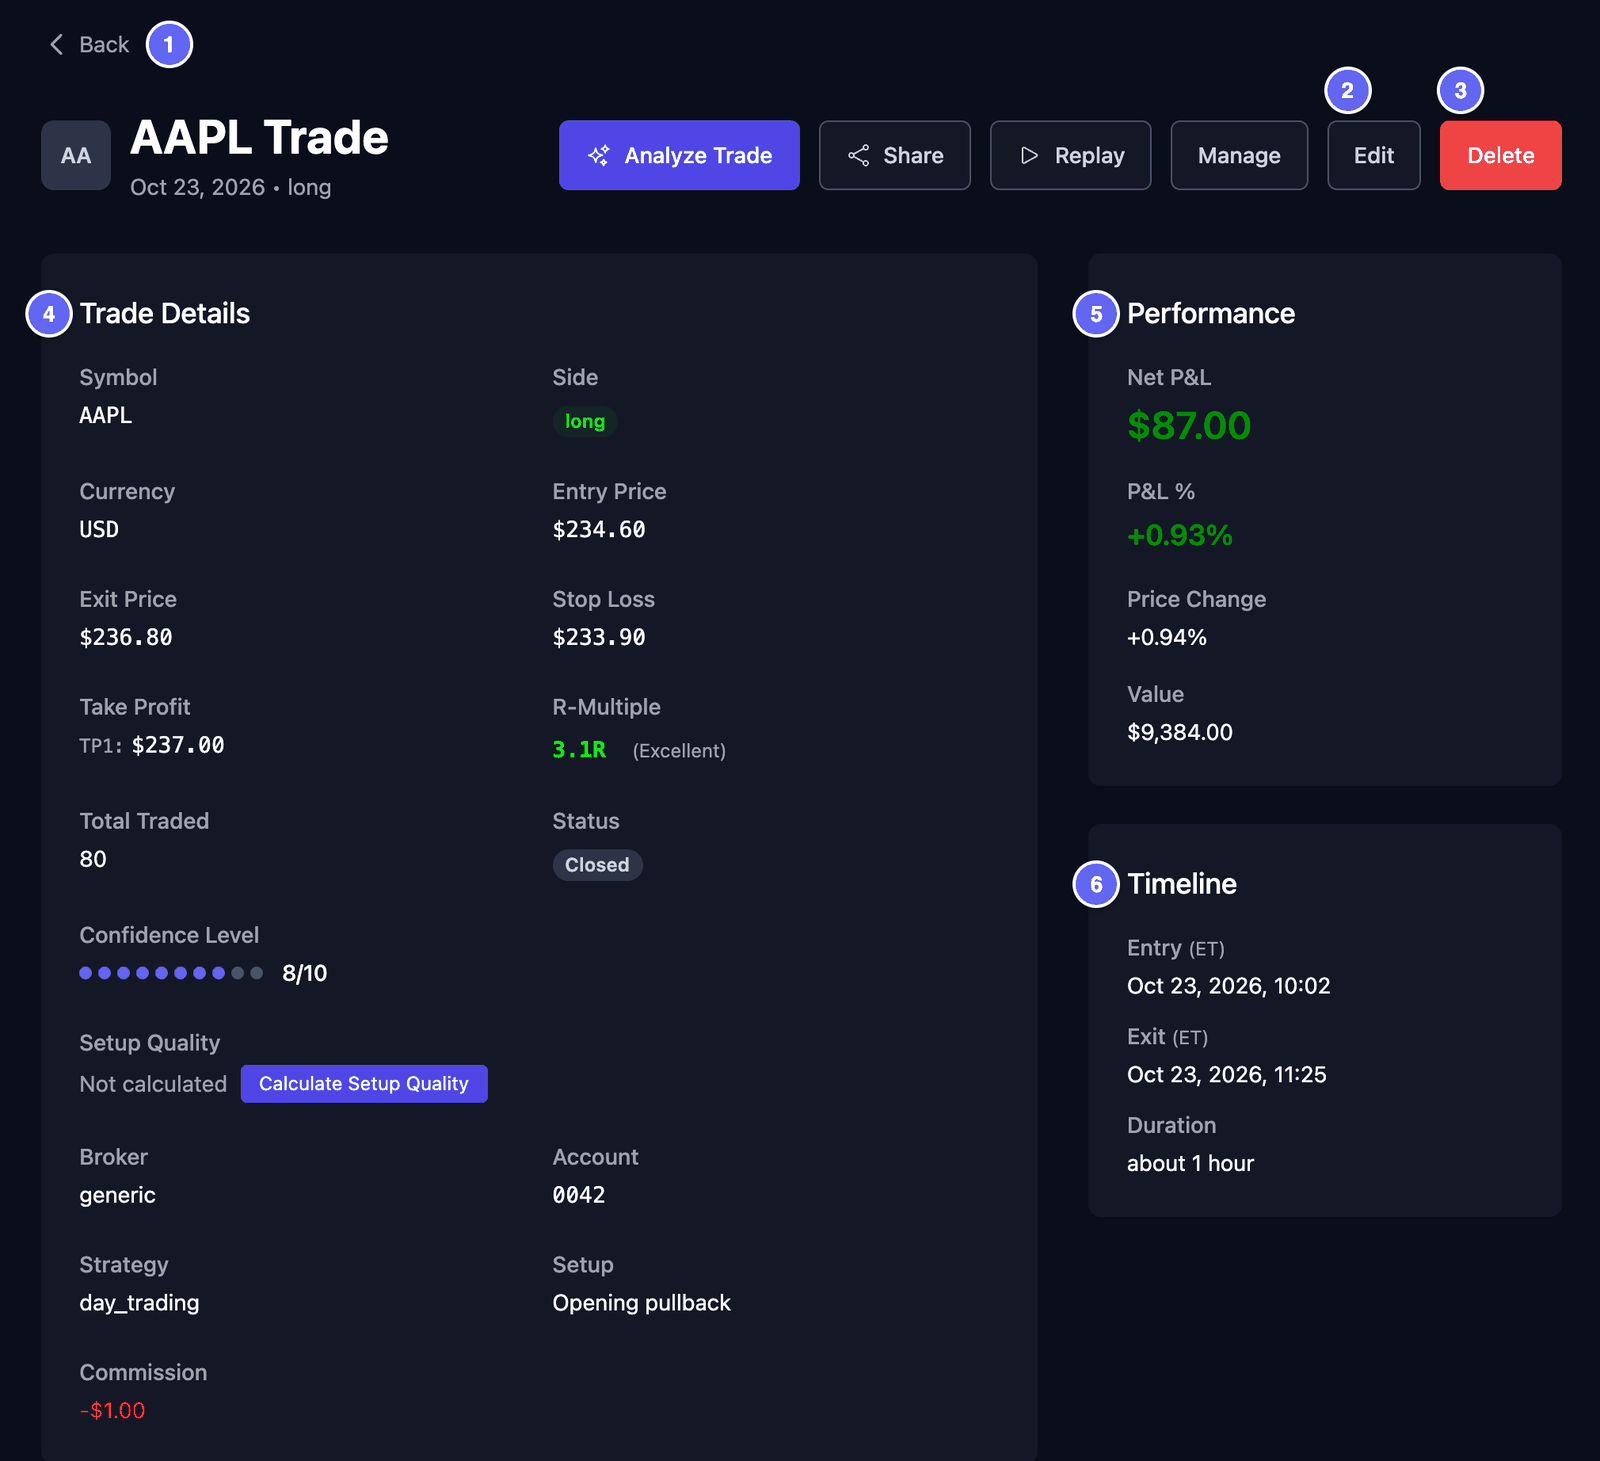

Trade Details shows:
- Symbol and Side. long means you bought first, hoping the price would go up. short means you sold first, hoping it would go down.
- Entry Price and Exit Price — the price you got in at and the price you got out at.
- Stop Loss — the price where you planned to get out if the trade went wrong.
- Take Profit — the price where you planned to take your profit (TP1, TP2 …).
- R-Multiple — how many times your planned risk you won or lost. Your planned risk is the gap between your entry price and your stop loss. 3.1R means you won 3.1 times that risk. -1.0R means you lost it once. It shows only for trades with a stop loss.
- Total Traded — how many shares you traded.
- Status — Open or Closed.
- Confidence Level — how sure you felt, from 1 to 10. You set it yourself.
- Strategy and Setup — your own names for the kind of trade. If you leave Strategy empty, HANSEI may fill it in, like
day_trading. It picks a name from how long you held the trade. You can change it. - Broker and Account — where the trade happened.
- Commission — what your broker charged for the trade.
Performance shows the result: Net P&L (your profit or loss after costs), P&L %, Price Change and Value. Value is the entry price times the number of shares. An open trade shows Open here, because HANSEI has no live prices.
Timeline shows when you got in and out, and how long you held the trade. The times are in your timezone. The short label, like ET, names it. You set your timezone in Settings and your data.
Executions, tags and notes
Lower on the page, you review the trade.
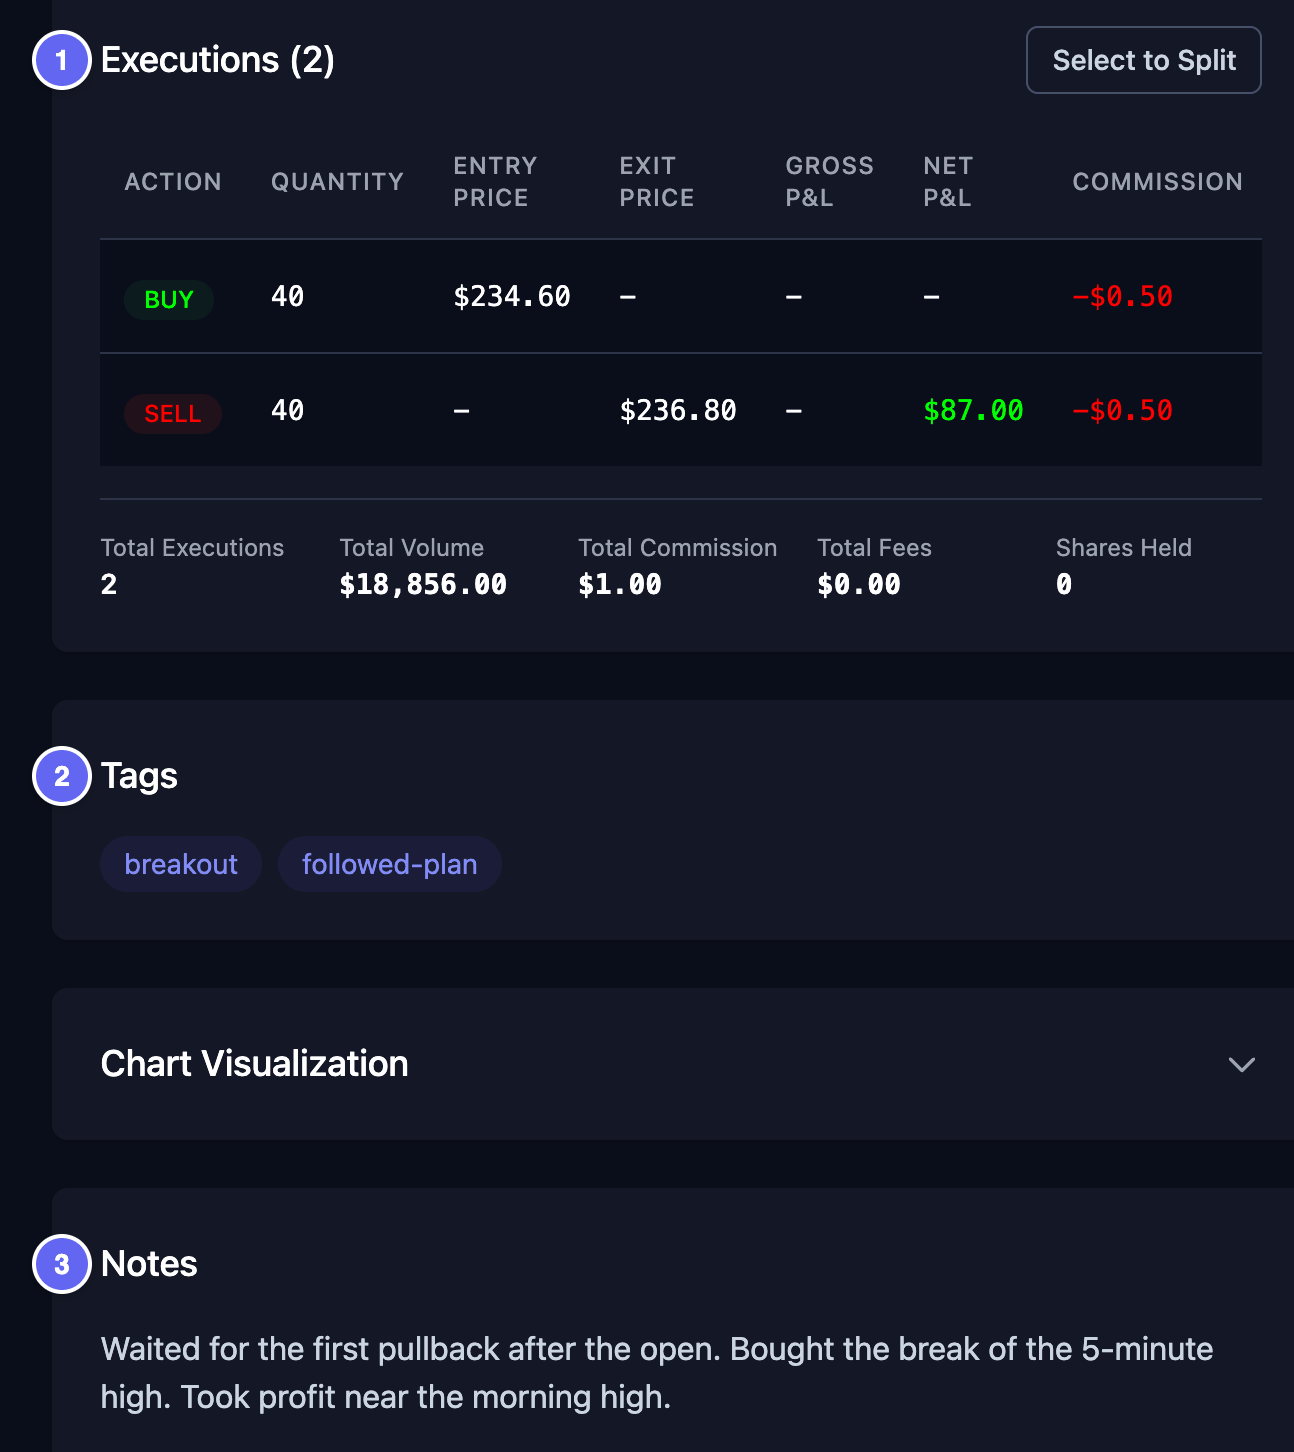

- Executions — an execution is one buy or one sell. Each row shows the Action (BUY or SELL), the quantity, the price, the commission and the time. Many trades have two rows: one buy and one sell. The totals are under the table.
- Tags — short labels you choose, like
followed-planorbreakout. They help you find trades later with Filters. - Notes — what you thought and what you learned.
- Trade Images — your own pictures, if you added some. Click one to see it large.
To change tags, notes or pictures, edit the trade.
Edit a trade
- On the trade page, click Edit. The Edit Trade page opens.
- Change what you need. The two pictures below show the main fields.
- Click Update Trade at the bottom. Cancel leaves without saving.
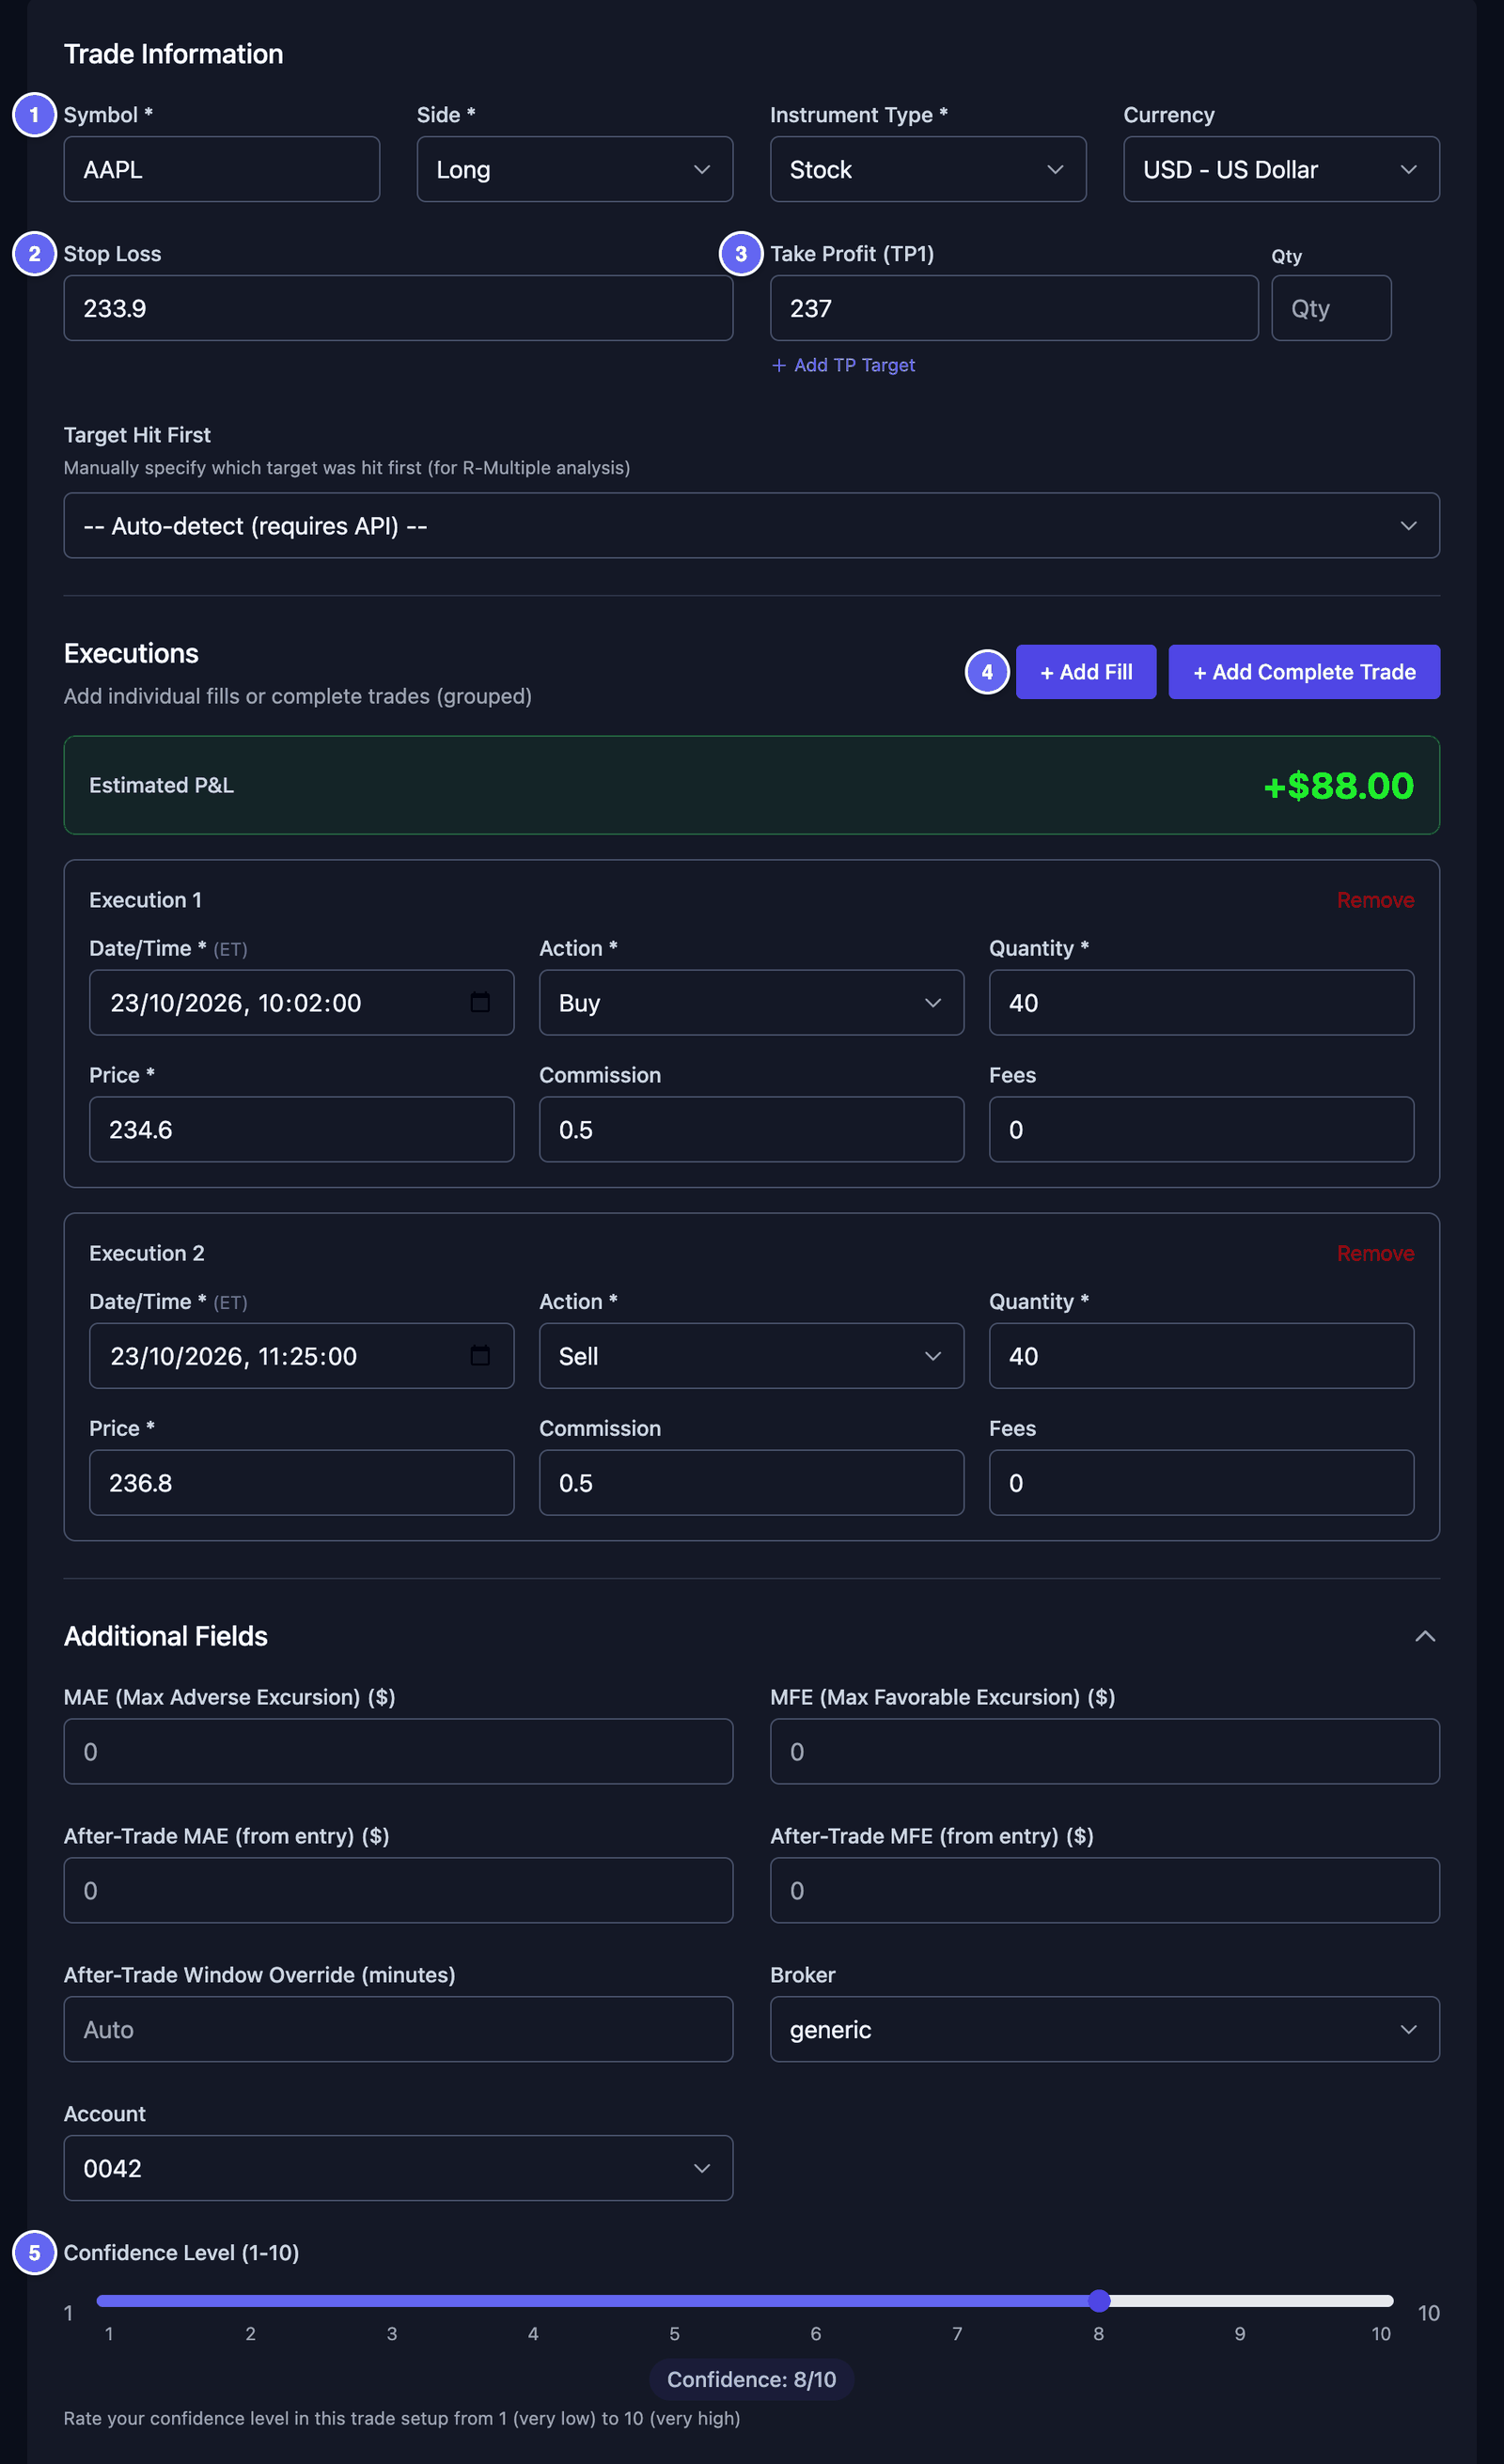

- Stop Loss — the price where you planned to get out if the trade went wrong. HANSEI uses it for the R-Multiple.
- Take Profit (TP1) — the price where you planned to take your profit. Add TP Target adds another one.
- Executions — change a buy or a sell here. Remove deletes one. + Add Fill adds one.
- Confidence Level (1-10) — drag the slider.
Click More Options to open more fields.
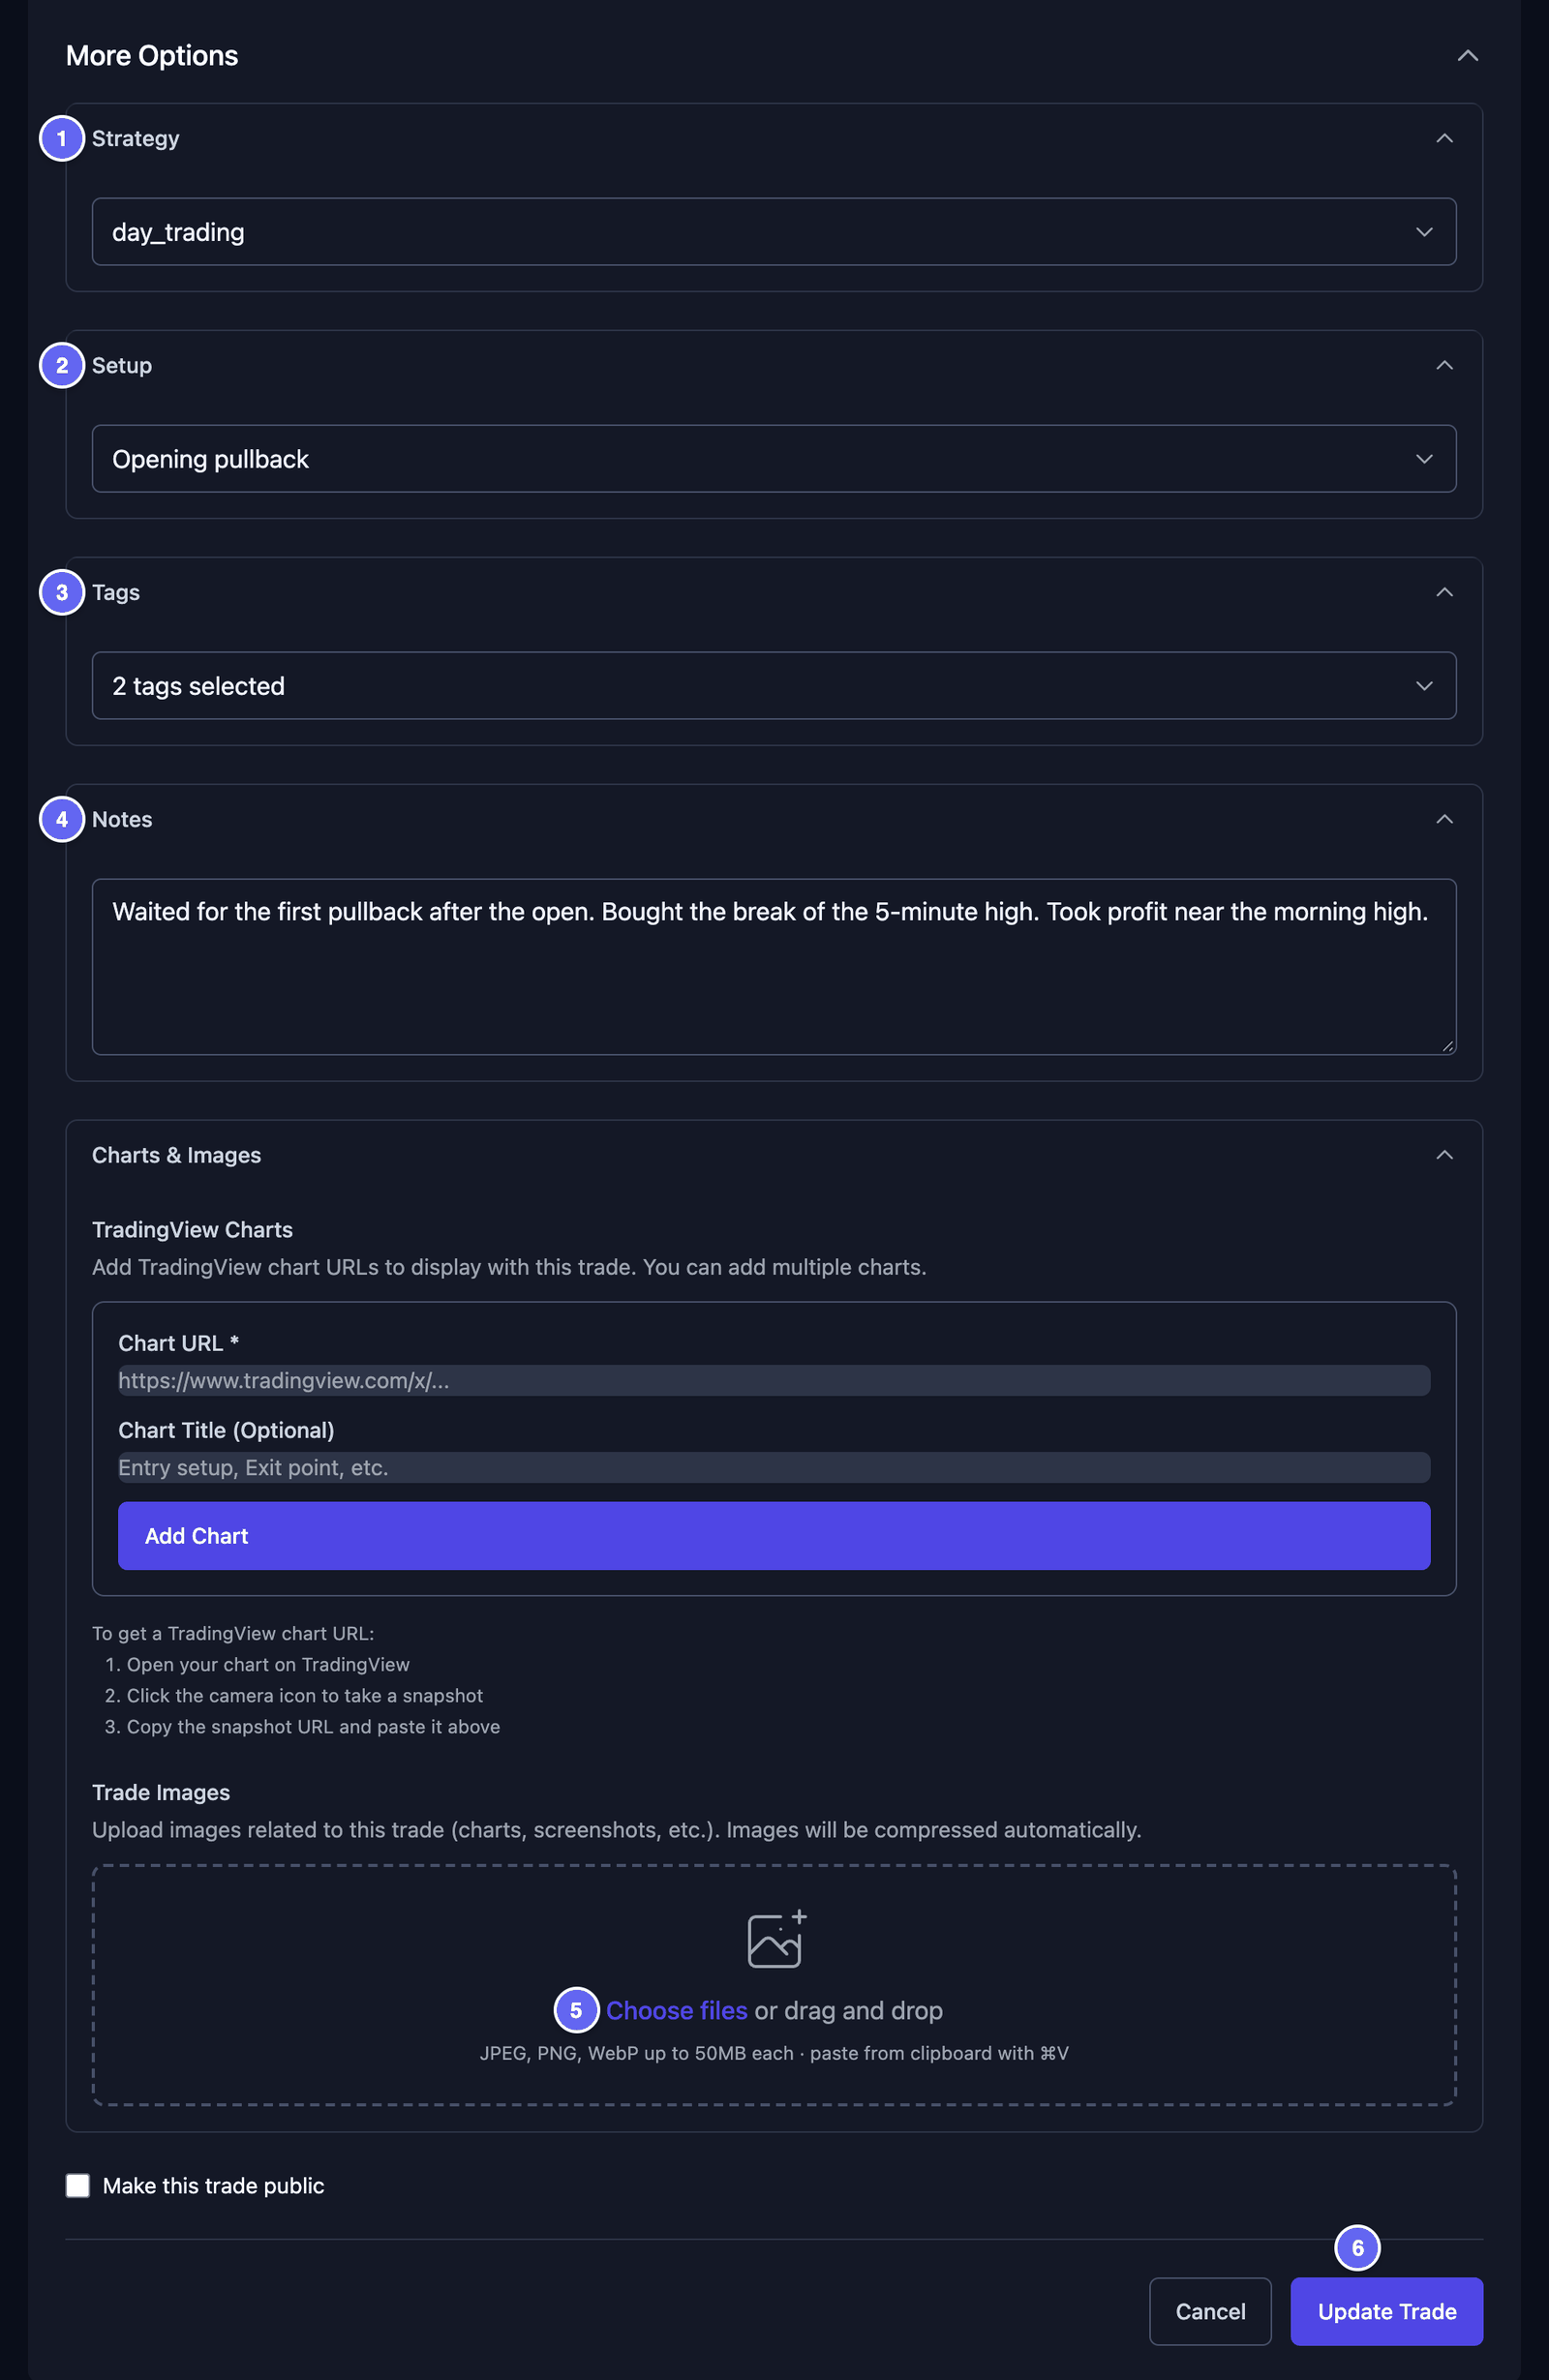

- Strategy and Setup — pick a name from the list. To make a new one, pick Add New Strategy or Add New Setup, then type it.
- Tags — tick the tags you want. Manage Tags makes a new tag.
- Notes — write your thoughts. For a new line, press Shift+Enter. Enter alone saves the whole trade.
- Charts & Images › Trade Images — click Choose files to add your own chart screenshots. You can also drag them in, or paste one. JPEG, PNG and WebP work. Add up to 10 at a time, under 50 MB in total.
When you click Update Trade, HANSEI may ask about Unsaved Images. Click Confirm. Your pictures are saved with the trade.
Grade a trade with a playbook
A playbook is your own checklist for one kind of trade. The Playbook & Manual Grading card on the trade page checks the trade against one. Under Playbook, open Select a playbook and pick yours. Tick the rules you followed, then click Save Playbook Review. To make a playbook first, see Metrics and playbooks.
Delete a trade
- On the trade page, click Delete.
- The Delete Trade window asks if you are sure. Click Confirm.
Deleting can't be undone. HANSEI then shows your list of trades. To delete many trades at once, see Work on many trades at once.
Add a trade by hand
You can type a trade yourself, for example one your broker's file missed. The form is the same as Edit Trade.
- In the menu, click Trades. Then click Add trade at the top right. The Add New Trade page opens.
- In Symbol, type the symbol, like
AAPL. - In Side, pick Long or Short.
- Leave Instrument Type on Stock.
- Under Executions, click + Add Fill once for each buy and once for each sell.
- In each fill, set Date/Time, Action (Buy or Sell), Quantity, Price and Commission.
- Click Create Trade.
Instead of fills, you can click + Add Complete Trade. It takes a whole trade in one card: the entry and the exit, with their prices and times.
An example, with made-up numbers: one fill Buy 40 shares at 234.60, and one fill Sell 40 shares at 236.80. When the sells cover the buys, the trade is closed. If not, it stays open.
Good to know:
- Add at least one fill or one complete trade. Without one, the trade can't be saved.
- The empty box says Add Execution. That means the + Add Fill button.
- Times are read in your timezone. The short label next to Date/Time names it.
- Pick an Account under Additional Fields. Without one, the trade shows only under All Accounts and Unsorted.
- Does Symbol say No symbols found? Keep typing. Any symbol works.
- Stop Loss, Take Profit, Confidence Level and More Options are optional. They work as in Edit a trade.