Metrics and playbooks
See your past trades as numbers, write your rules as playbooks, and check how well you kept to them.
These pages turn the trades you imported into numbers and charts. You find them in HANSEI's menu under Metrics and Analysis. The numbers describe your past trades. They never promise future results.
Performance
In the menu, click Metrics, then Performance. The page is called Analytics.
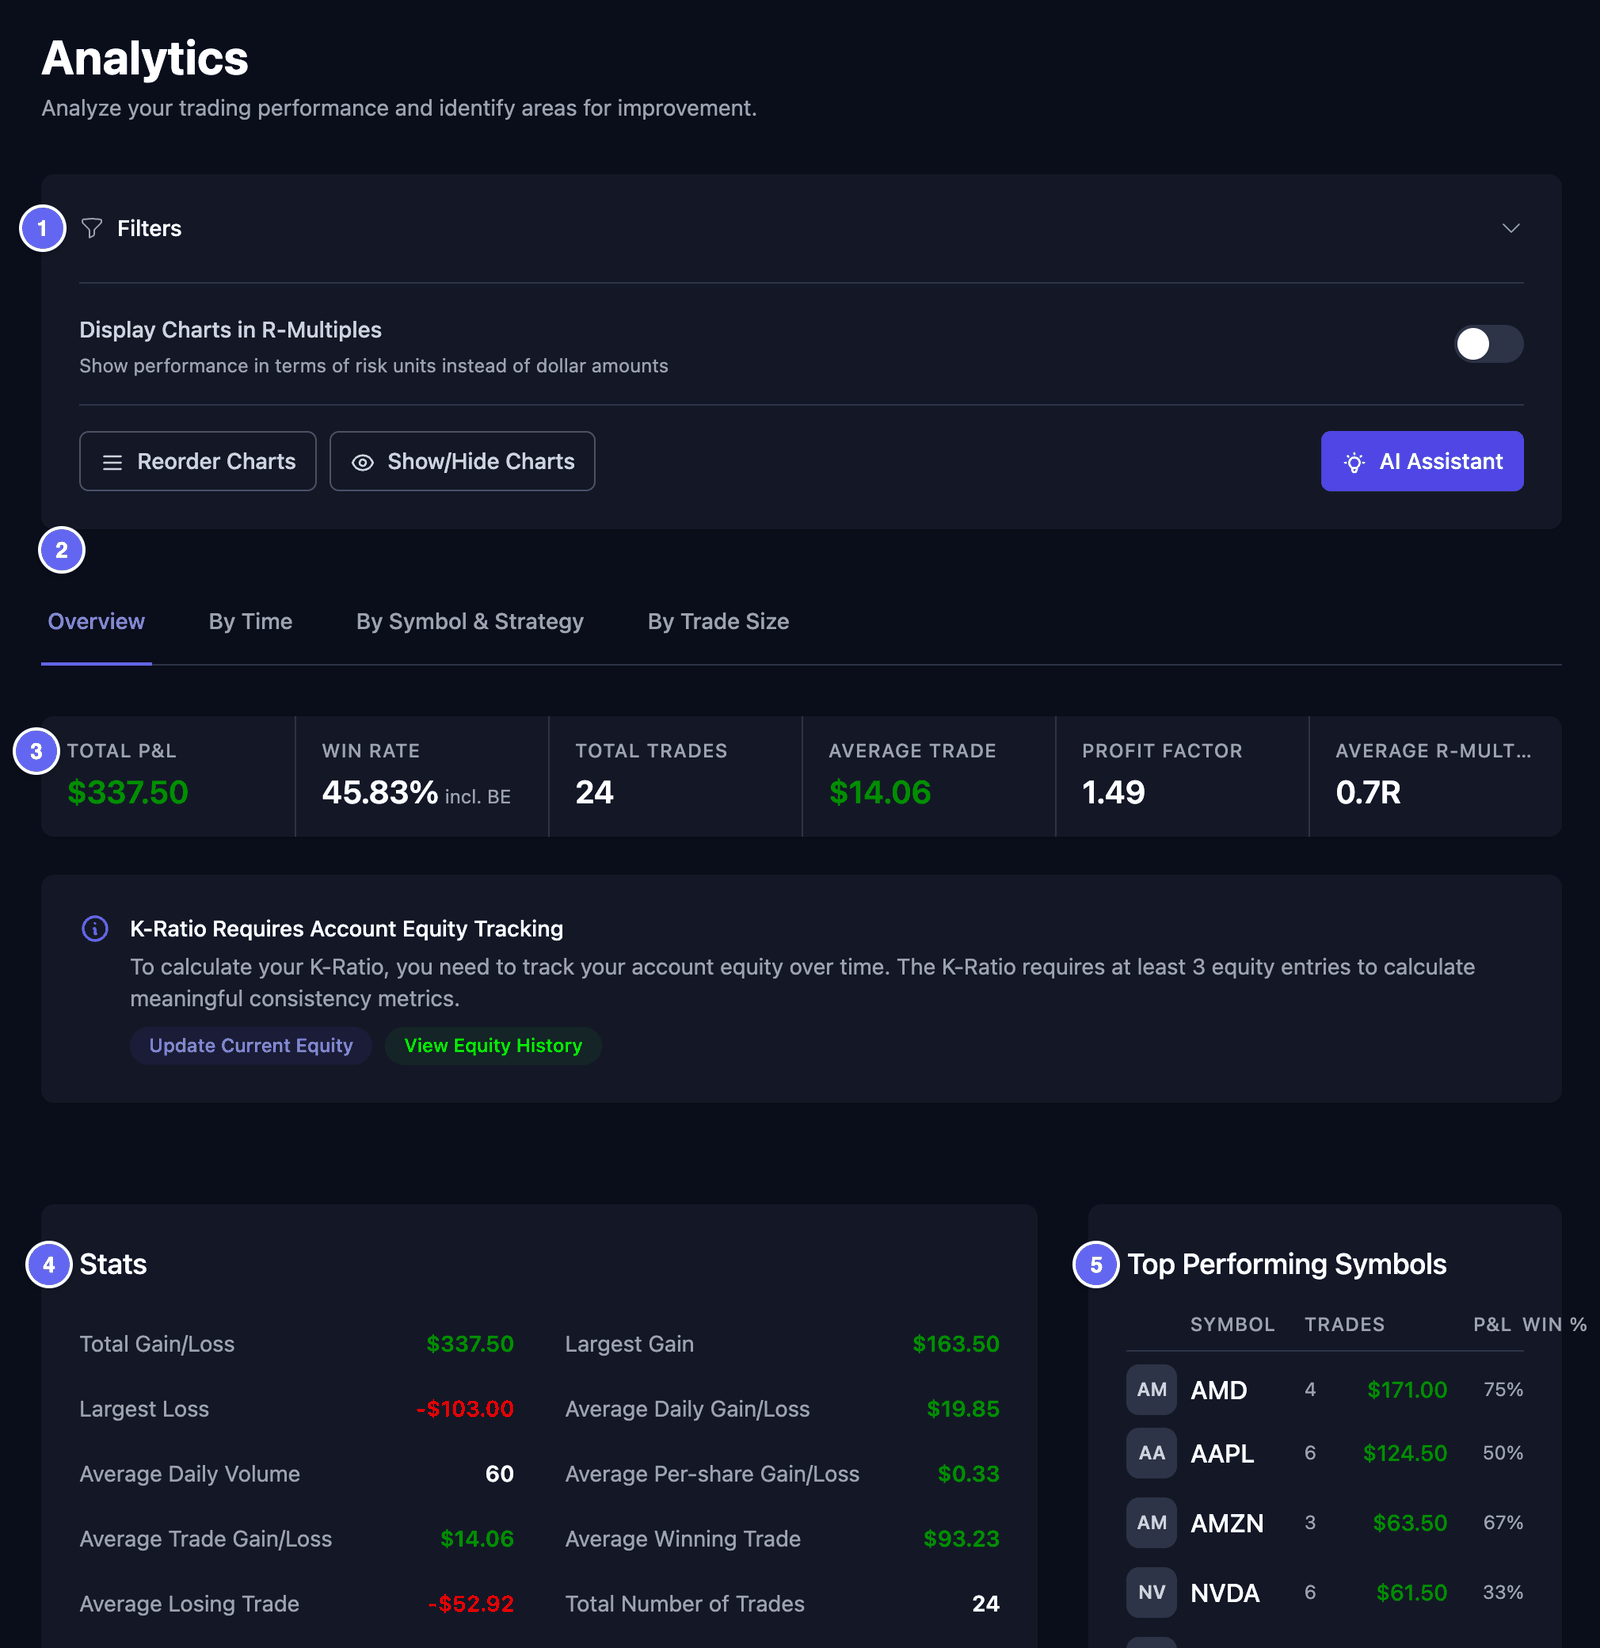

At the top of the page:
- Filters opens a panel. Choose a stock, dates, a strategy or tags. Then click Apply Filters. Reset clears them.
- Display Charts in R-Multiples shows results in R instead of dollars. R is explained below.
- Reorder Charts lets you drag the cards into a new order. Click Done when you finish.
- Show/Hide Charts lets you choose which cards show.
The tabs:
- Overview — the summary row, Stats and Top Performing Symbols.
- By Time — your results by day, week or month, by weekday, by hour, and by how long you held.
- By Symbol & Strategy — your results for each tag, and for each strategy or setup.
- By Trade Size — your results by share price and by the size of your trades.
Click a bar in a chart to see the trades behind it.
The summary row
- Total P&L — P&L means profit and loss. This is your total gain or loss.
- Win Rate — the share of trades that made money. incl. BE means breakeven trades count too. A breakeven trade neither won nor lost.
- Total Trades — how many trades count.
- Average Trade — the average result of one trade.
- Profit Factor — all your gains divided by all your losses. Above 1 means the gains were bigger.
- Average R-Multiple — your average result in R.
R is the amount you planned to risk on a trade. It is the distance from your entry price to your stop loss. A stop loss is the price where you planned to get out, to limit a loss. A result of +2R means you made twice what you risked. A trade needs a stop loss to have an R.
Numbers to start with
The Stats card has many numbers. These are a good start:
- Average Winning Trade and Average Losing Trade — what a typical win made, and what a typical loss cost.
- Largest Gain and Largest Loss — your best single trade and your worst single trade.
- Max Consecutive Wins and Max Consecutive Losses — your longest run of wins in a row, and of losses in a row.
If you chose the median in Settings, some labels say Median instead of Average.
The K-Ratio stays at 0.00 until you add at least three equity entries. Equity is what your account is worth on a given day. The note on the page has a View Equity History button. See Equity History.
Monthly
In the menu, click Metrics, then Monthly. The page is called Monthly Performance. It shows your months side by side.
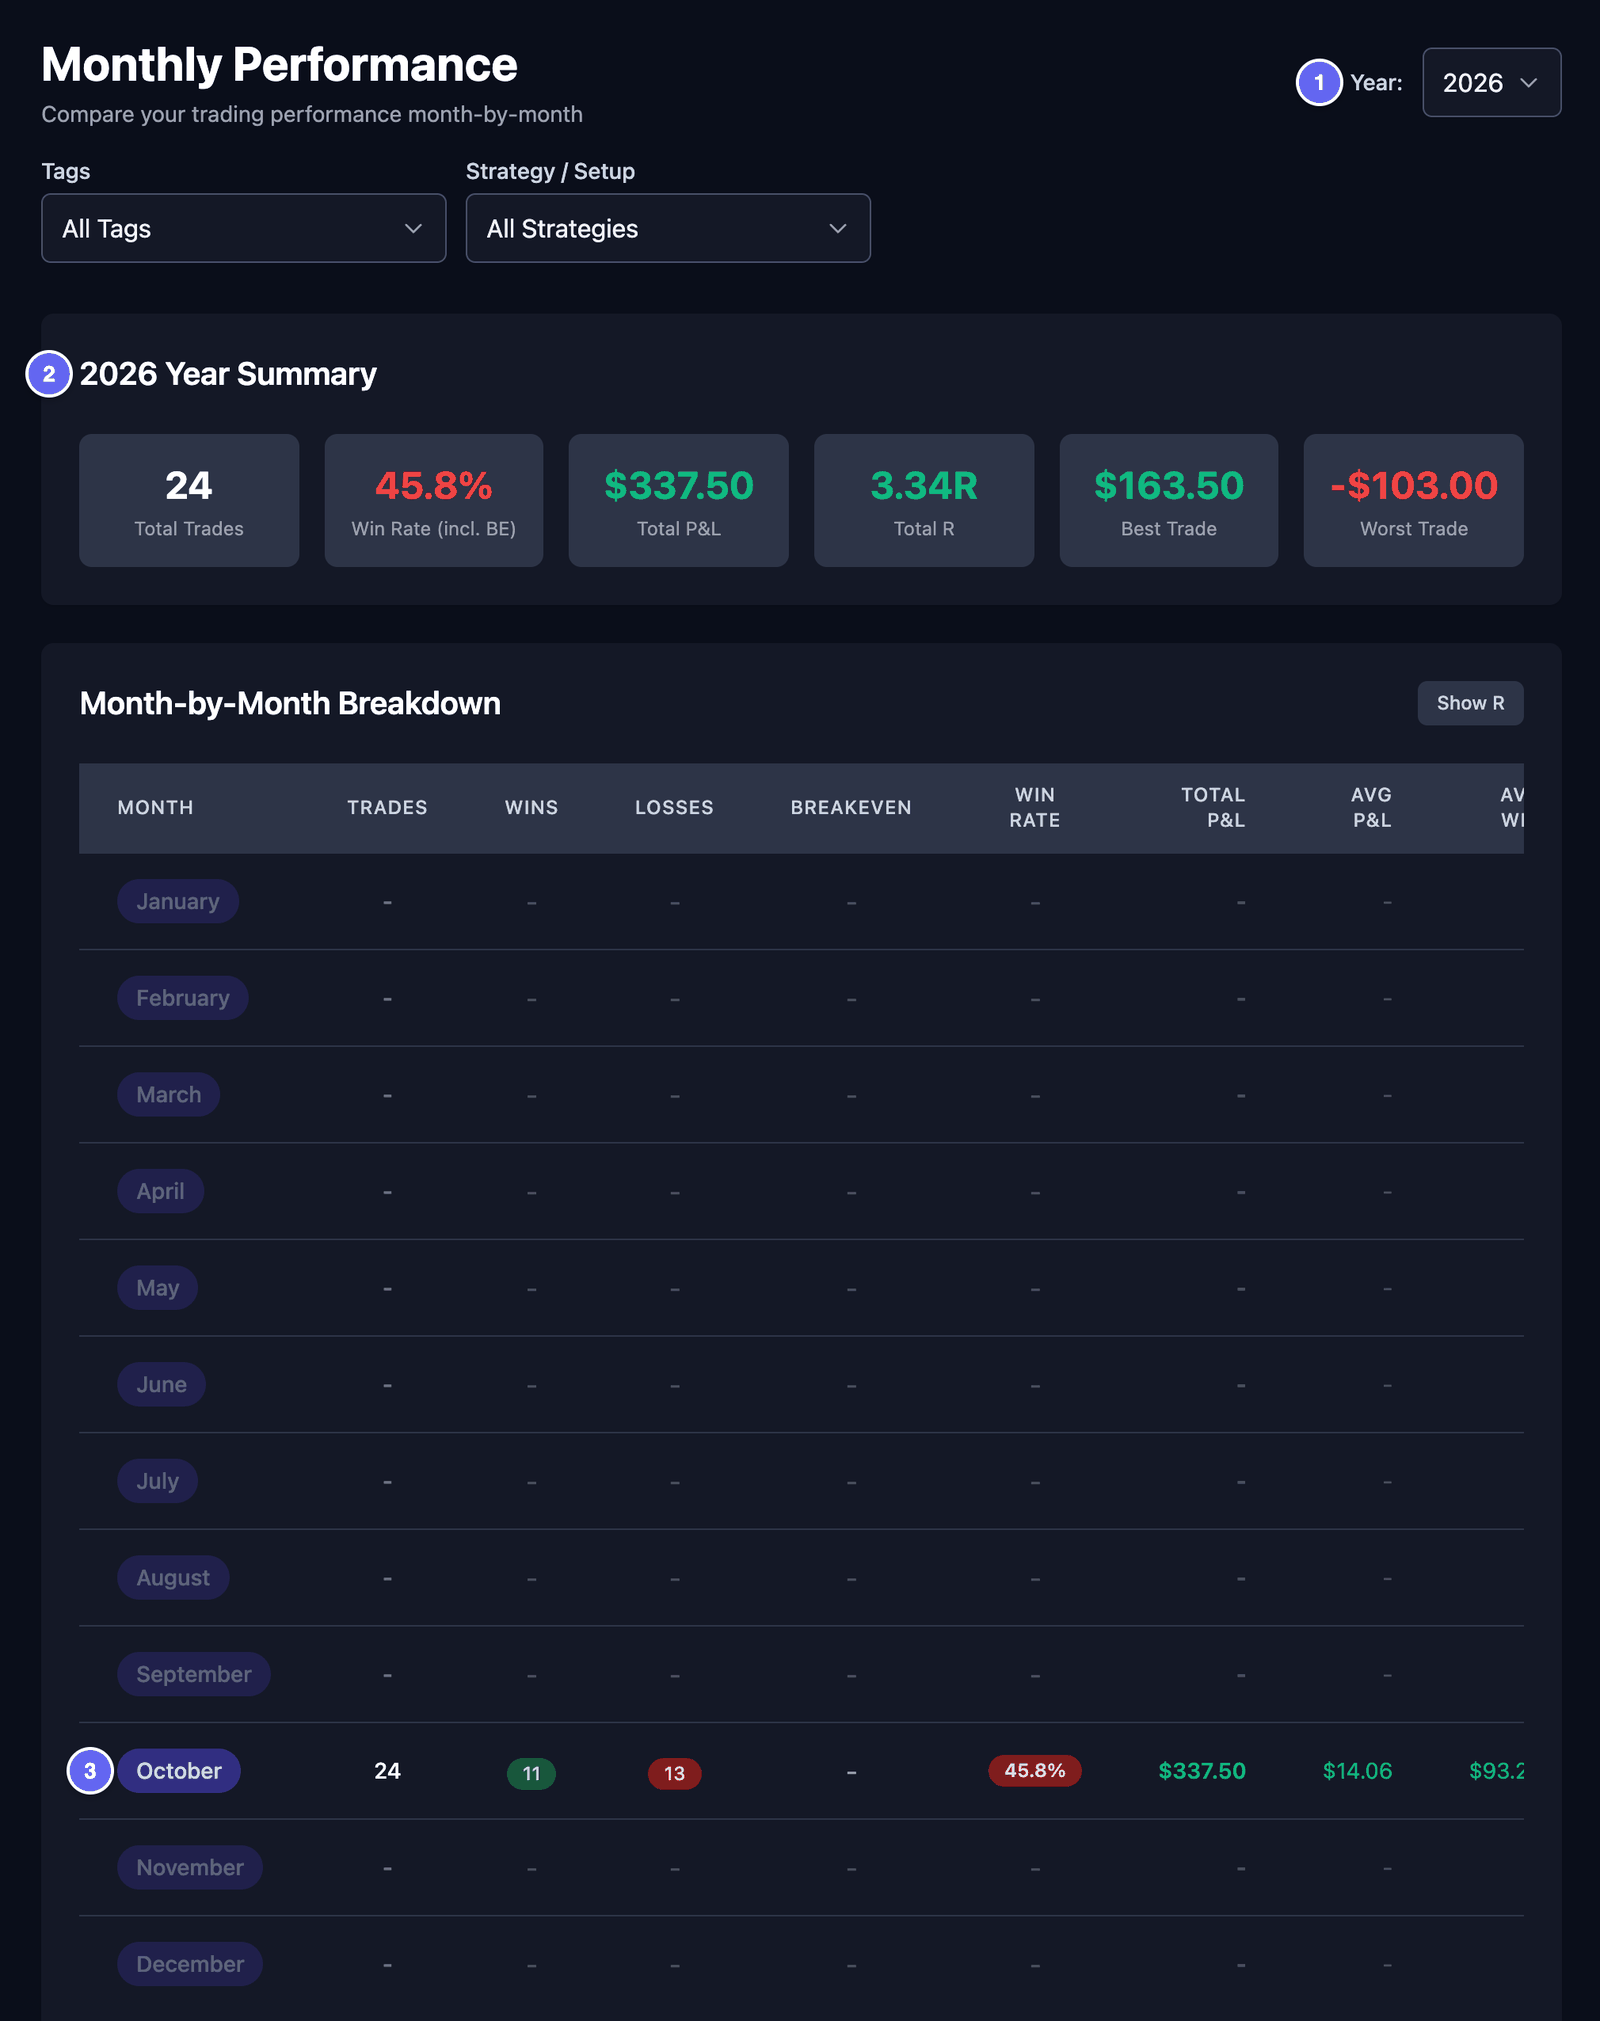

- Year — choose a year. You can go back four years.
- Tags and Strategy / Setup — show only the trades with these tags, or with this strategy or setup.
- The year summary — Total Trades, Win Rate (incl. BE), Total P&L, Total R, Best Trade and Worst Trade.
- Month-by-Month Breakdown — trades, wins, losses, win rate and P&L for each month. A month without trades shows "-". Click Show R to see the R columns too.
- Two charts at the bottom — Monthly P&L Trend and Win Rate by Month. Show R-Value switches the first chart to R.
This page has no date filter. It always shows a whole year.
Edge Report
The Edge Report sums up one week of trading. It shows what worked and what cost you.
- In the menu, click Metrics, then Edge Report.
- Click Generate for this week. The first time, you can also click Generate now.
HANSEI makes the report for the last full week, Monday to Sunday. The week in progress is not included. You can't choose an older week. If that week has no closed trades, no report is made, and a message says so.
HANSEI makes a report only when you ask for one. Your reports stay on the page. When you have more than one, click a week at the top to switch.
The report shows:
- Net P&L, Win Rate, Trades and Profit Factor, each compared with the week before.
- Your edge — the group of trades that did best that week. It needs at least two trades in the group.
- Your leak — the group of trades that cost you the most.
- This week's action item — one reminder taken from your own numbers. It is not advice.
- Coach's notes — a short summary of your week, written from your numbers.
- Playbook adherence — how often you kept to your playbooks. It shows only after you review trades against a playbook. See Playbooks and grading.
Partial Exits
This page helps only if you sold some trades in parts. For example, you bought 100 AAPL shares. Then you sold 50, and later the other 50. Each sale is an exit.
In the menu, click Metrics, then Partial Exits. The page is called Partial Exit Analytics.
- It uses only trades with at least two exits. Without any, it says No partial exit data found.
- Set the filters at the top, then click Apply Filters. Min Partials, Max Partials and Min Eligible Trades narrow the table further.
- The three tiles count the trades it used and the most exits in one trade.
- The table has one row for each exit: the first sale, the second sale, and so on.
- Abs. Hit % — out of all the trades used, how often this exit made money.
- Cond. Hit % — how often this exit made money when the exit before it also made money.
- Moves are in points (pts). For a stock, 1 point is a $1 move in the share price.
- The R columns and Avg SL need a stop loss on the trade. Without one, they show "--".
Behavioral
This page looks for habits in your trades. One example is revenge trading. It means trading again quickly after a loss, to win the money back. Many traders do this sometimes. The page helps you notice it.
- In the menu, click Metrics, then Behavioral. The page is called Behavioral Analytics.
- Set filters if you want, then click Apply Filters.
- Click Analyze Historical Trades. HANSEI looks through your past trades.
The page doesn't judge you. Use it to notice your own habits.
Overview
- The four tiles count revenge trading: Revenge Trading Events, Revenge Trading Loss Rate, Avg Duration and Total Revenge P&L.
- Behavioral Insights shows an Overall Risk Score from 0 to 100. A higher score means more of these patterns. Recommended Actions are short reminders.
- Trading Personality Profiling describes your trading style, for example Scalper (very short trades) or Swing (trades held for days). It needs at least 20 completed trades. Click Refresh Analysis to update it.
Patterns
- Session activity timeline — pick a day to see when you entered trades. Amber dots mark days with more trades than usual after a loss.
- Revenge Trading Detection — each case found: the losing trade, and the trades that came after it. Re-run Revenge Detection checks again.
- Loss Aversion Behavior Analysis — loss aversion means keeping losing trades longer than winning ones. Click Analyze Exit Patterns. Then compare Winners Hold Time with Losers Hold Time. The money figures beside them are only rough estimates.
- Overconfidence Indicators — click Analyze Overconfidence. It looks for bigger trades after a run of wins.
Settings
- Revenge Trading Detection — turn the check on or off.
- Detection Sensitivity — Low, Medium or High. High notices smaller losses.
- Cooling Period — the break you want after a loss, in minutes.
Your changes save as you make them.
Playbooks and grading
A playbook is your written rules for one kind of trade. It has a checklist. After a trade, you check the trade against the list. Over time, you see how often you kept to your rules.
In the menu, click Analysis, then Playbooks & Grading. The page is called Playbooks & Grading Profiles. HANSEI calls a playbook a profile.
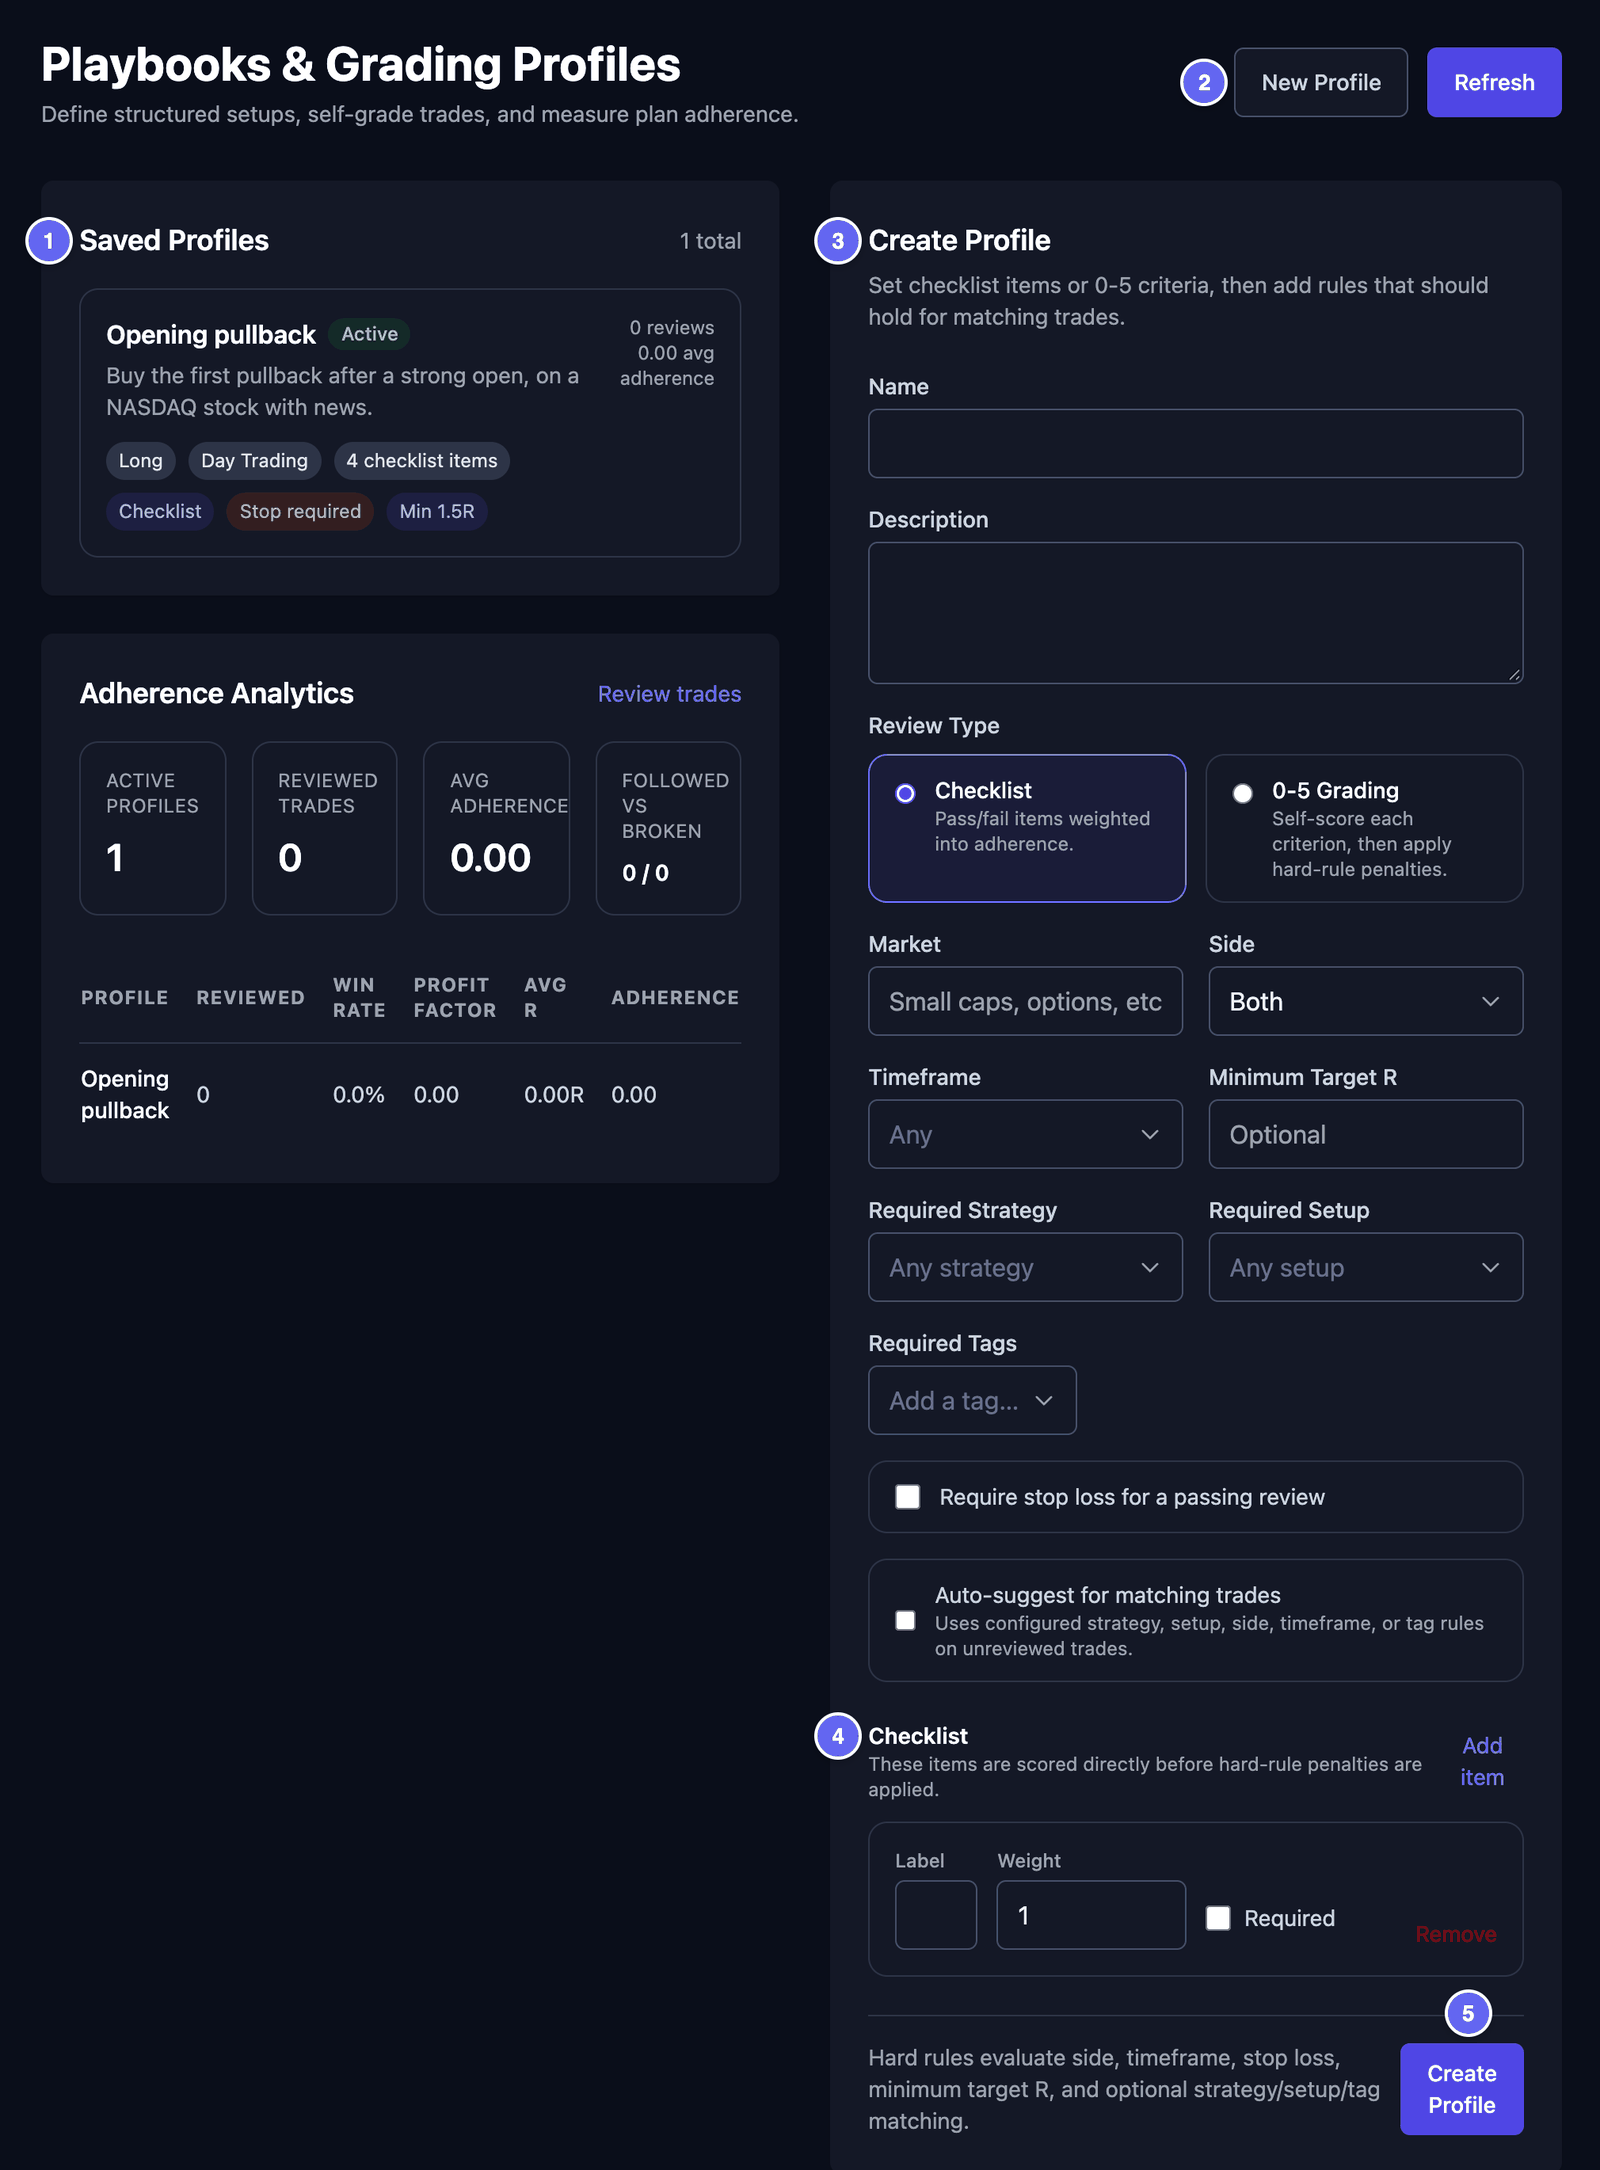

Make a playbook
- Click New Profile.
- Type a Name, for example Opening pullback. Add a Description in your own words.
- Under Review Type, choose Checklist. Each rule is then a yes-or-no item. 0-5 Grading lets you score each point from 0 to 5 instead.
- If you like, say what the rules apply to: Market, Side, Timeframe, Minimum Target R, Required Strategy, Required Setup and Required Tags. For Side, Long means you buy first, hoping the price rises. Short means you sell first, hoping it falls.
- Tick Require stop loss for a passing review if every trade must have a stop loss.
- Tick Auto-suggest for matching trades if HANSEI should suggest this playbook on trades that fit it.
- Under Checklist, type your first rule under Label. Click Add item for each next rule. Weight sets how much a rule counts. Tick Required for a must-have rule.
- Click Create Profile.
To change a playbook later, click it under Saved Profiles, then click Save Profile. Archive keeps it in your numbers, but you can't pick it for new reviews.
Grade a trade
- In the menu, click Trades, then click a trade.
- Find Playbook & Manual Grading.
- Under Playbook, choose your playbook.
- Tick each checklist item you followed.
- Set Followed plan? to Yes or No.
- Click Save Playbook Review.
More about the trade page: One trade.
Back on the playbooks page, Adherence Analytics shows how often you kept to your playbooks. Adherence means keeping to your rules. The tiles are Active profiles, Reviewed trades, Avg adherence and Followed vs broken. The table below compares the results of each playbook.
The journal's Playbook Setup entry type is a different thing. It is a journal note. See Write an entry.
Trade Management
This page compares your plan with what happened, in R. Each trade needs a stop loss. A target, or take profit, is the price where you planned to take your profit.
In the menu, click Analysis, then Trade Management.
R-Multiple Performance adds up your R, trade after trade. Only trades with a stop loss count.
- Actual R (Net) — what you really made, in R.
- Target R (Net) — what you would have made at your targets.
- Management R — the difference between the two.
- R Left on Table — R you missed by leaving before your target. It needs targets.
- Win Rate and Avg R — as on the Performance page.
Check one trade
- Under Select a Trade to Analyze, click a trade. Its badge says what it needs: Needs SL (no stop loss yet), No TP (no target) or Ready.
- If the trade has no stop loss, a form opens, for example Set Risk Levels for AAPL.
- Type the Stop Loss Price. Or click a Quick set stop loss button, such as 1% risk.
- Under Take Profit Mode, choose Single or Multiple Targets. Type the Take Profit Price if you had one.
- If you know it, choose under Which target was hit first?: TP Hit First or SL Hit First.
- Click Save & Analyze.
You then see R-Multiple Analysis and Trade Summary: your plan next to the result. In Target Hit Analysis, choose Manual. Tick the target or stop loss that the price reached. Clear all selections removes the ticks.
This page can't show a price chart, because HANSEI has no price data.
Prop Firm
This page is only for you if you trade a funded account from a prop firm. A prop firm lends you a trading account. In return, you must keep to its rules, such as a largest daily loss. This page checks your trades against those rules.
First, you need a trading account in HANSEI with an Account Identifier. Only those accounts can be chosen. See Accounts and cash.
- In the menu, click Analysis, then Prop Firm.
- Click Add rule profile.
- Under Trading account, choose the account.
- Type a Label: a name you will recognise.
- Type your prop firm's rules: Account size, Evaluation start date, Minimum trading days, Max daily loss, Profit target and Max drawdown. Drawdown is how far your account falls from its highest point.
- Choose the Drawdown mode. Static keeps the lowest allowed balance fixed, below your start. Trailing raises it each time your account reaches a new high.
- Click Add profile.
The rule profile then shows as a card:
- A state: On track, Warning (close to a limit), Breached (a rule was broken), Passed or No data.
- The tiles Equity, Today, High Water and Trading Days. High Water is the highest your account reached.
- Bars for the Profit target, the Drawdown buffer and the Daily loss headroom. Headroom is how much more you could lose today.
HANSEI works these out from your closed trades, at the end of each day. Your prop firm's own figures are the ones that count.
Edit changes the rules. Delete removes the rule profile. Your trades are not affected.