Your list of trades
See all your trades, find them with filters and change many at once.
The Trades page lists every trade in your journal, newest first. Here you find trades, filter them and change many at once. Click a trade to see all its details.
Open the list
- In HANSEI's menu on the left, click Trades.
A new journal shows No trades. Click Import trades to bring in a file from your broker. Or click Add manually to type a trade yourself. See Import your trades.
What the list shows
At the top, the P&L Summary adds up the trades in the list. P&L means "profit and loss".
- Gross — your profit or loss before costs. Costs are the commissions and fees your broker charged.
- Net — your profit or loss after costs.
- Win Rate — the share of trades that ended with a profit. incl. BE counts breakeven trades too. A breakeven trade closed at the price it opened. excl. BE leaves them out.
Unrealized stays at $0.00. It needs live prices, which HANSEI doesn't have.
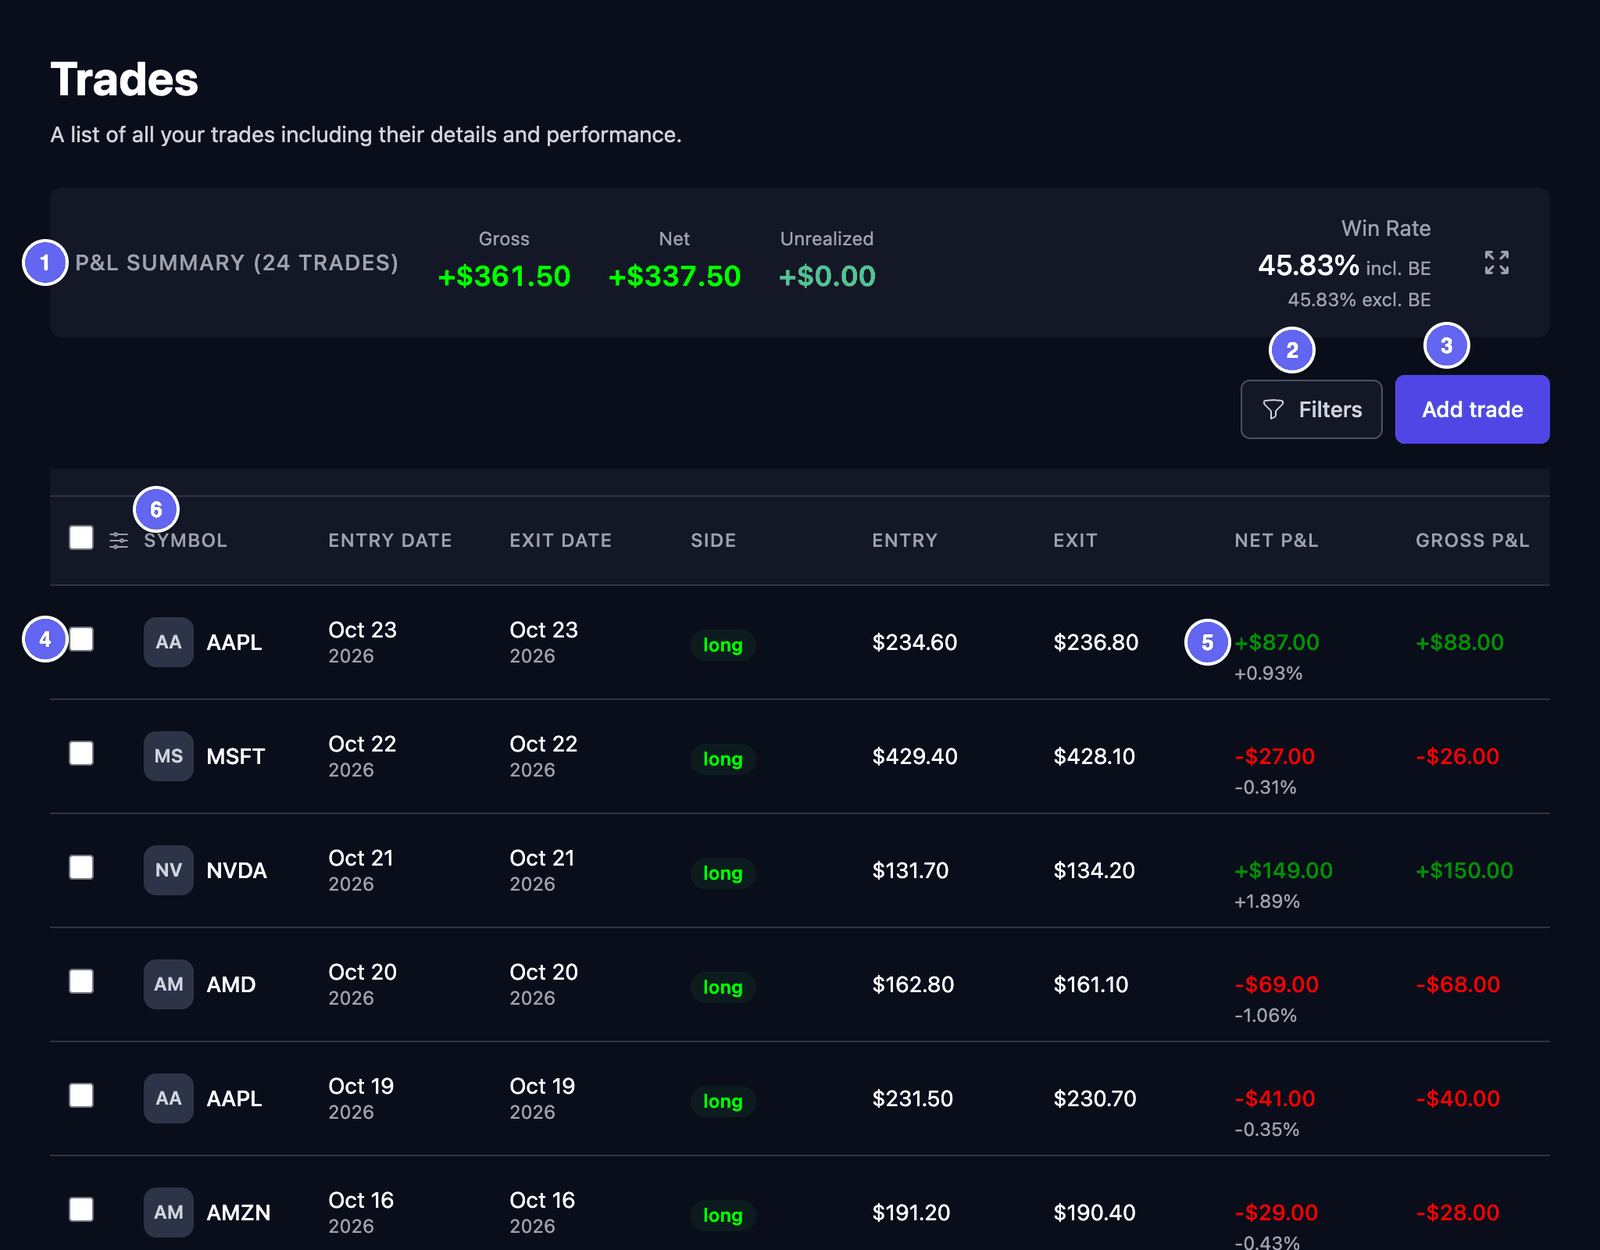

Each row is one trade. The first columns are:
| Column | What it shows |
|---|---|
| Symbol | The stock, like AAPL. |
| Entry Date and Exit Date | The day you got in and the day you got out. |
| Side | long: you bought first and sold later, hoping the price would go up. short: you sold first and bought back later, hoping the price would go down. |
| Entry and Exit | The price you got in at and the price you got out at. |
| Net P&L | Your profit or loss after costs, with the percent under it. |
| Gross P&L | Your profit or loss before costs. |
An open trade has no exit yet. It shows - in Exit Date, Exit and the P&L columns.
The grey tile next to a symbol shows its first two letters, like AA for AAPL. HANSEI shows letters, not company logos.
The list is sorted by date, newest first. You can't sort it another way. Scroll sideways for more columns, like Confidence, Status and Strategy. On a phone, each trade shows as a card.
To choose the columns:
- Click the column settings icon. It sits in the header row, next to the first tick box.
- Tick the columns you want, like Setup, Tags, Stop Loss or R-Multiple. Untick the ones you don't need.
- To change the order, drag a column by its handle (☰).
- Click Apply. Nothing changes until you do.
Reset to default brings back the first columns. Some columns stay empty in HANSEI, like Unrealized, Quality and Sector. They need live market data. You can untick them. Your columns are saved with your account.
To open a trade, click its row. See One trade.
Find trades with filters
Filters show only the trades you want to see.
- Click Filters. The Filters window opens.
- Fill in what you want to keep. The fields are below.
- Click Apply Filters. The window closes and the list changes.
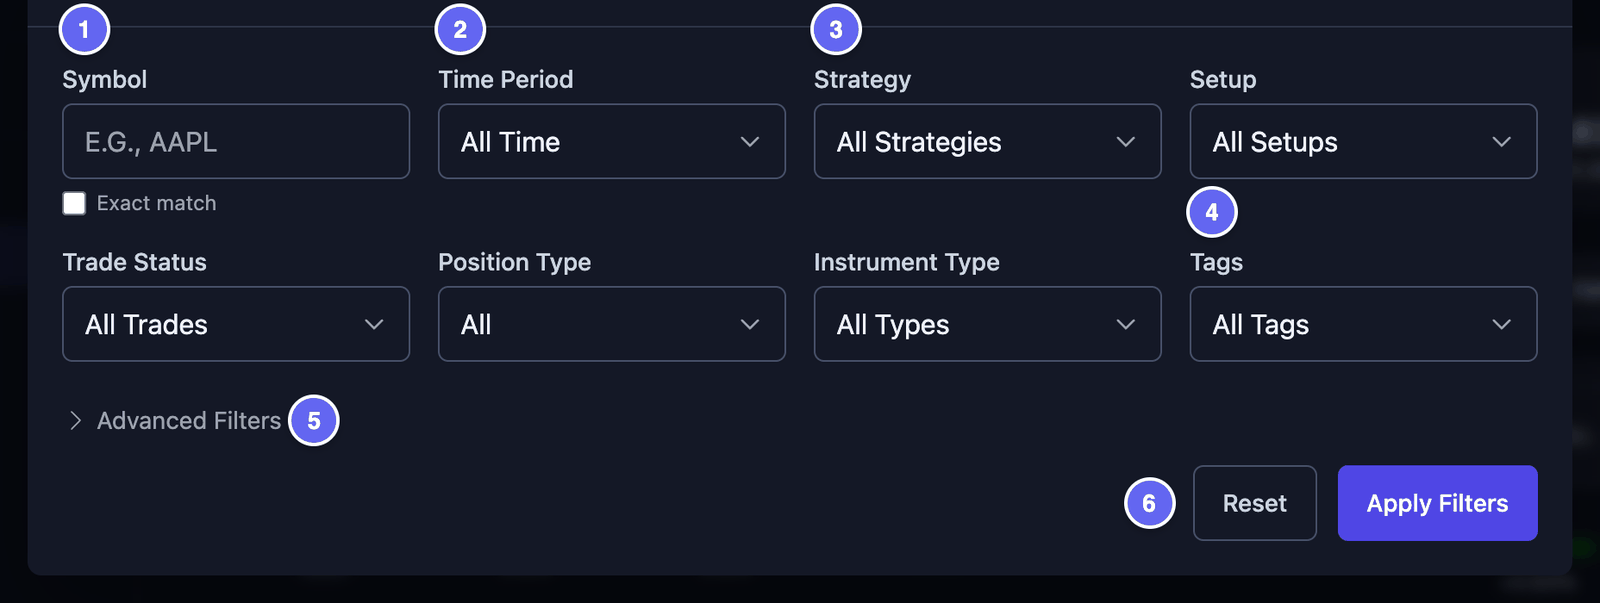

- Symbol — type the start of a symbol.
AAfinds AAL and AAPL. Tick Exact match to find one symbol only. If you click a symbol in the suggestions, the filter works at once. - Time Period — like Today, This Month or Last 30 Days. Custom Range lets you pick a Start Date and an End Date. A trade counts if it opened or closed in that time.
- Strategy and Setup — pick one or more of your own names.
- Trade Status — All Trades, Open Only or Closed Only.
- Position Type — All, Long or Short.
- Instrument Type — the kind of trade, like Stocks or Options.
- Tags — pick one or more tags. A trade with any of them shows.
- Advanced Filters — more choices: price, quantity and P&L ranges, Market Session, Day of Week, Broker, and P&L Type (only profits or only losses).
Sector, News and Quality Grade need market data. They find nothing in HANSEI.
A dot on Filters means filters are on. Reset clears them all. Do you see No trades after filtering? Open Filters and click Reset.
Filters has no account field. To see one account, use the account picker in the menu. See the account picker.
Work on many trades at once
- Tick the box at the start of each trade you want. The box in the header row ticks every trade on this page.
- A bar appears above the list. It says how many trades you ticked.
- Click what you want to do. The choices are below.
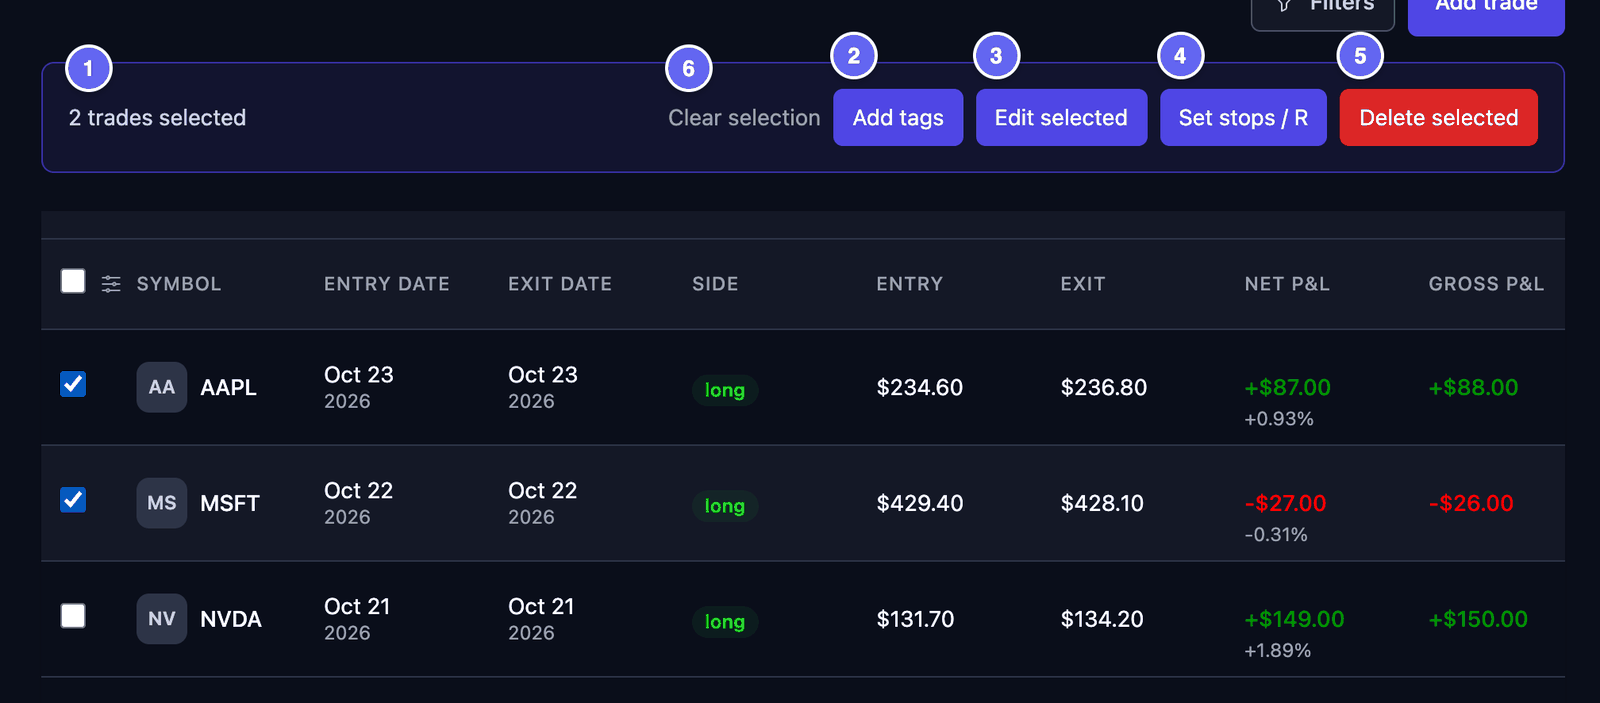

- Add tags — adds tags to every ticked trade. Their old tags stay. Tick the tags you want, then click Add Tags.
- Edit selected — sets the same Account, Setup or Strategy on every ticked trade. For each one, choose Keep unchanged, Set value or Clear value. Then click Apply to 2 trades (with your own number).
- Set stops / R — type a stop loss for each trade. A stop loss is the price where you planned to get out if the trade went wrong. HANSEI then shows each trade's R: its result compared with that planned risk. An empty box keeps the old stop. Click Save 2 stops (with your own number).
- Delete selected — deletes every ticked trade. A window asks you to confirm. Deleting can't be undone.
- Clear selection — unticks all trades.
For a long trade, the stop must be below the entry price. For a short trade, it must be above.
Ticks stay when you go to another page. Work on one page at a time.
Pages
The list shows 50 trades per page. With more than 50 trades, page buttons show under the list.
- A line like Showing 1 to 50 of 132 results tells you where you are.
- Click a page number or an arrow to move to another page. On a phone, click Previous or Next.
When you reload the page, the list goes back to page 1.
Add a trade by hand
Click Add trade at the top right. See Add a trade by hand.