The dashboard and the calendar
See how your trades went, in a few numbers, cards and a calendar.
The Dashboard shows how your trades went, in a few numbers and cards. The Calendar shows each trading day in green or red. Both use only the trades in your journal. They look back. They don't predict anything.
Open the dashboard
HANSEI opens on the dashboard. To come back to it later:
- In HANSEI's menu on the left, click Dashboard.
- Click Trading Dashboard.
The page is called Dashboard.
No trades yet? The cards stay empty until you import your trades.
The numbers at the top
The row at the top sums up your trades.
- Net P&L — your profit or loss after costs. P&L means "profit and loss". Costs are the commissions and fees your broker charged. The line under it shows your number of trades, days and costs.
- Win Rate — the share of your trades that ended with a profit. 11W · 13L means 11 wins and 13 losses. incl. BE means breakeven trades count too. A breakeven trade closed at the price it opened.
- Profit Factor — your wins divided by your losses, in money. Above 1 means your wins were bigger in total. Below 1 means your losses were bigger.
- Streak — your winning or losing days in a row, up to your last trading day. 1W means one winning day. 2L means two losing days. best is your longest winning run.
Green numbers are above zero. Red numbers are below zero.
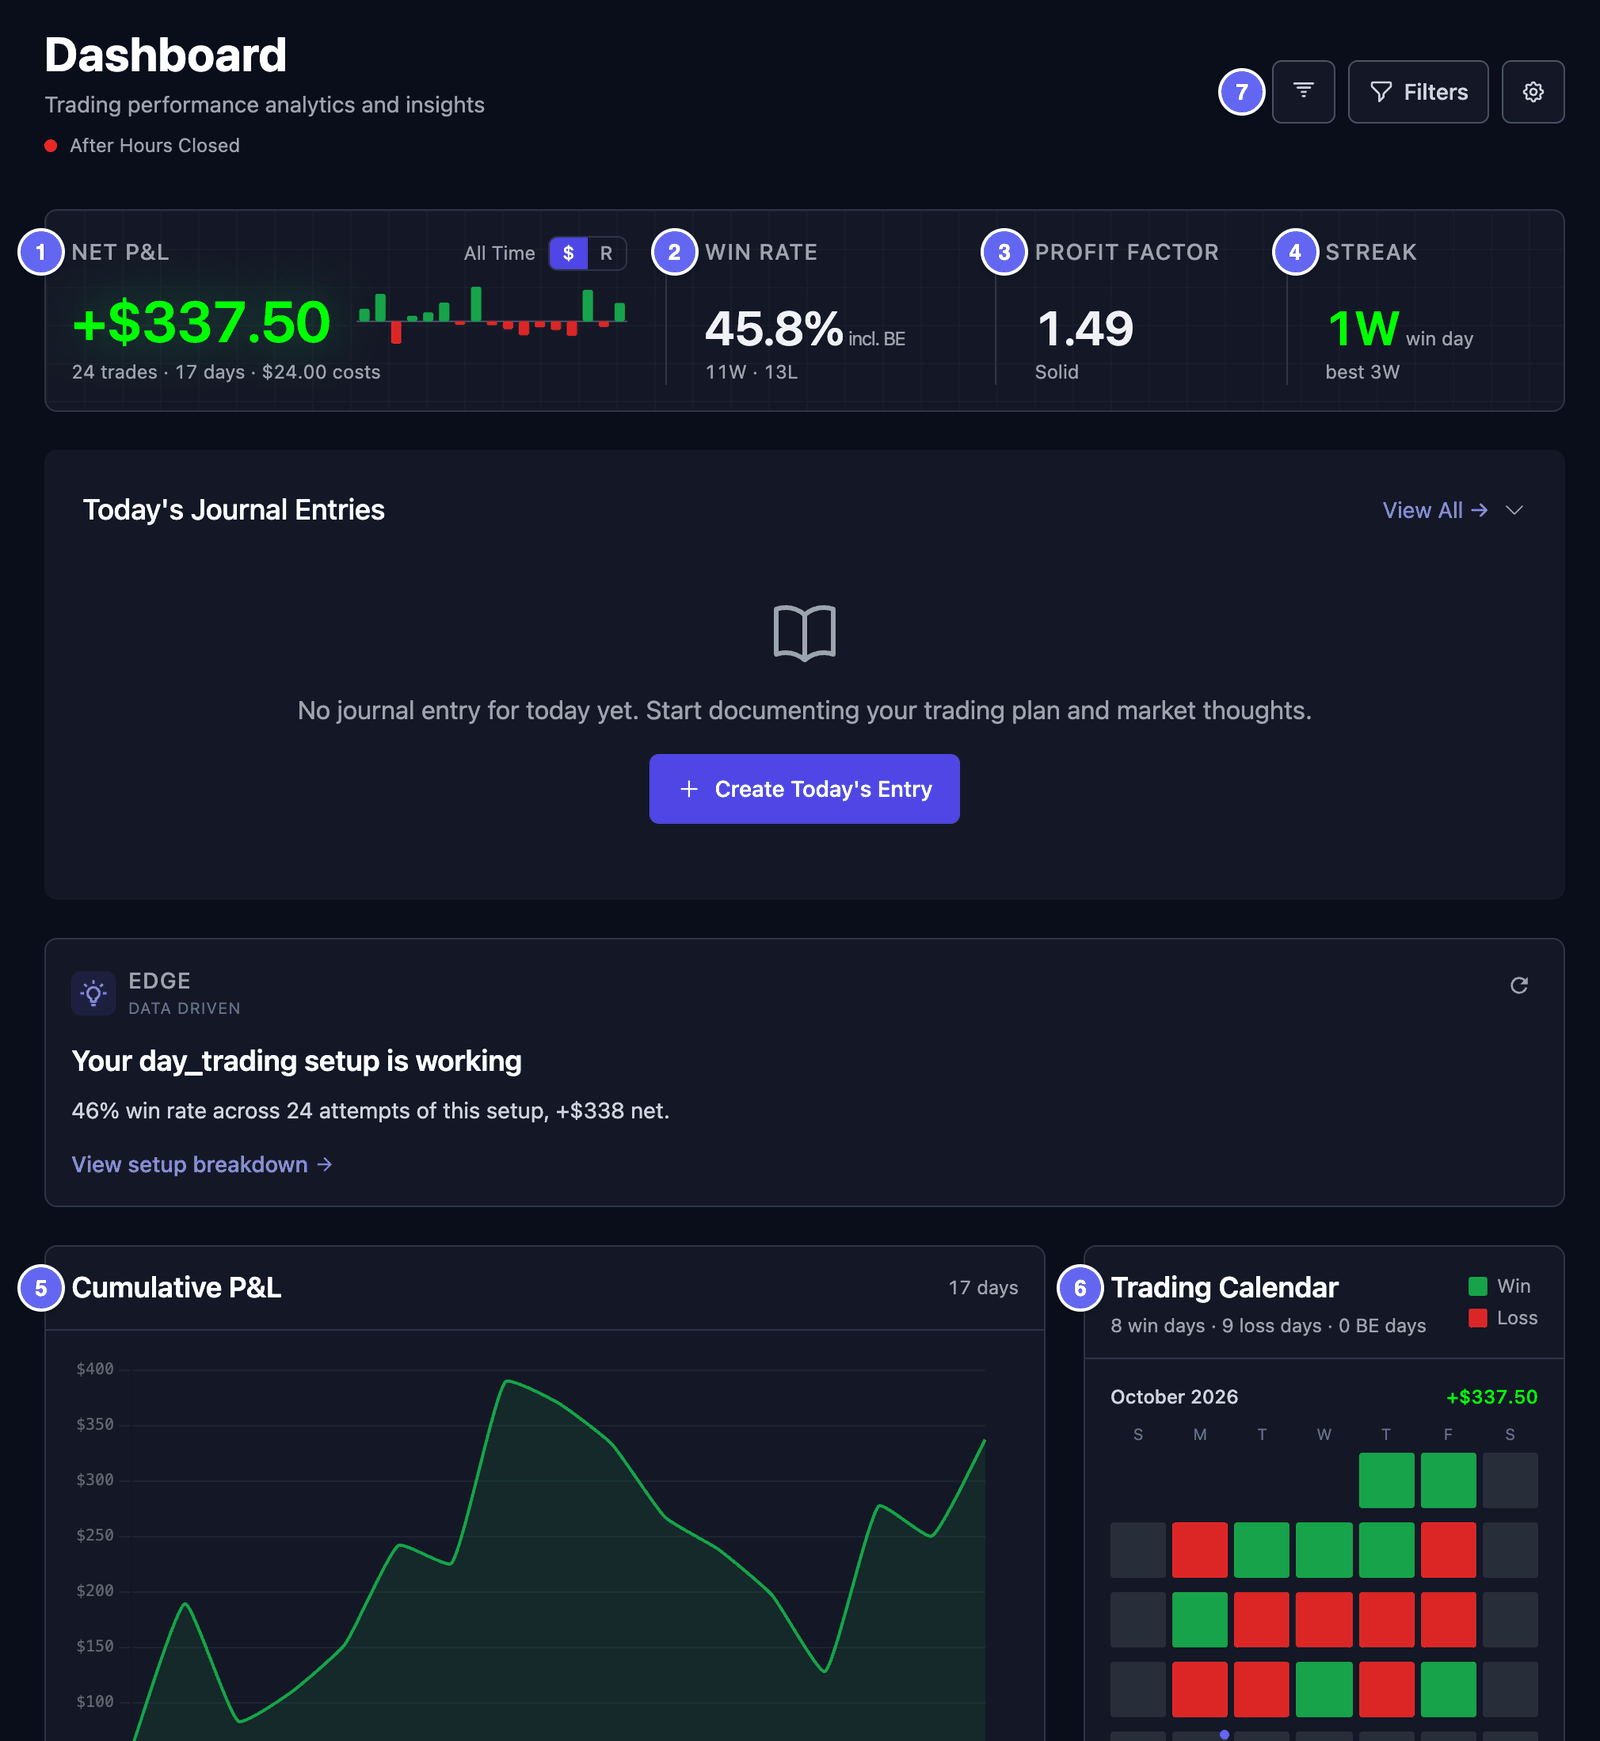

See it in R. Next to Net P&L, click R. R compares a result with the risk you planned. Your risk is the gap between your entry price and your stop loss. A stop loss is the price where you planned to get out if the trade went wrong. Winning twice that gap is +2R. Only trades with a stop loss count. Click $ to go back to money.
The cards
Under the numbers, cards show more detail. From top to bottom:
- Today's Journal Entries — today's notes from your journal. Click Create Today's Entry to write one.
- A tip card — one short fact from your past trades, like the setup that did best. It shows after a few trades. It is not advice.
- Cumulative P&L — your running total, day by day. Click a point to see that day's trades.
- Trading Calendar — this month, one square per day. Green is a day with a profit. Red is a day with a loss. Click a coloured day to see its trades.
- Momentum — your last days as green and red blocks, with your Best streak and Worst streak. Switch between By day and By trade.
- Risk Signals — short reminders about patterns in your trades, like a run of losses. It needs at least 10 closed trades. A closed trade is one you have both entered and exited.
- Recent Trades — your 10 latest closed trades. Click one to open it. View all opens your list of trades.
- Win Rate — your wins, losses and breakevens, with your average win and average loss.
Some cards need live market prices. HANSEI doesn't have them. So Market Risk and the news column stay empty. Open Positions shows what you paid, but no current price. You can hide these cards: see Change the cards.
Choose the dates and filters
Three buttons at the top right change what the dashboard counts.
To choose the dates:
- Click the first button. It has only an icon.
- Pick a range, like This Month, Last 30 Days or Year to Date.
All Time counts every trade. Custom Range lets you pick two dates. A dot on the button means a range other than All Time is on.
To filter the trades:
- Click Filters. The Filter dashboard window opens.
- Choose what to keep. For example, type
AAPLin Symbol, or pick a Strategy, a Setup or Tags. - Click Apply Filters.
A number on Filters shows how many filters are on. Reset clears them. The fields work as on the Trades page.
To see one account only, use the account picker at the top of the menu. See the account picker.
Change the cards
You choose which cards show, and in what order.
- Click the gear at the top right. Each card gets a bar with its name.
- To move a card, drag it by the six dots at the left of its bar.
- To hide a card, click the eye on its bar. Visible changes to Hidden. Click it again to show the card.
- Click Done when you finish.
Reset brings back the first layout. Your layout is saved with your account. It looks the same on every computer.
A few cards are hidden at first, like Performance by Symbol & Top Trades and Additional Statistics. Show them the same way. To hide the empty market card, hide Market Risk Indicators.
The calendar
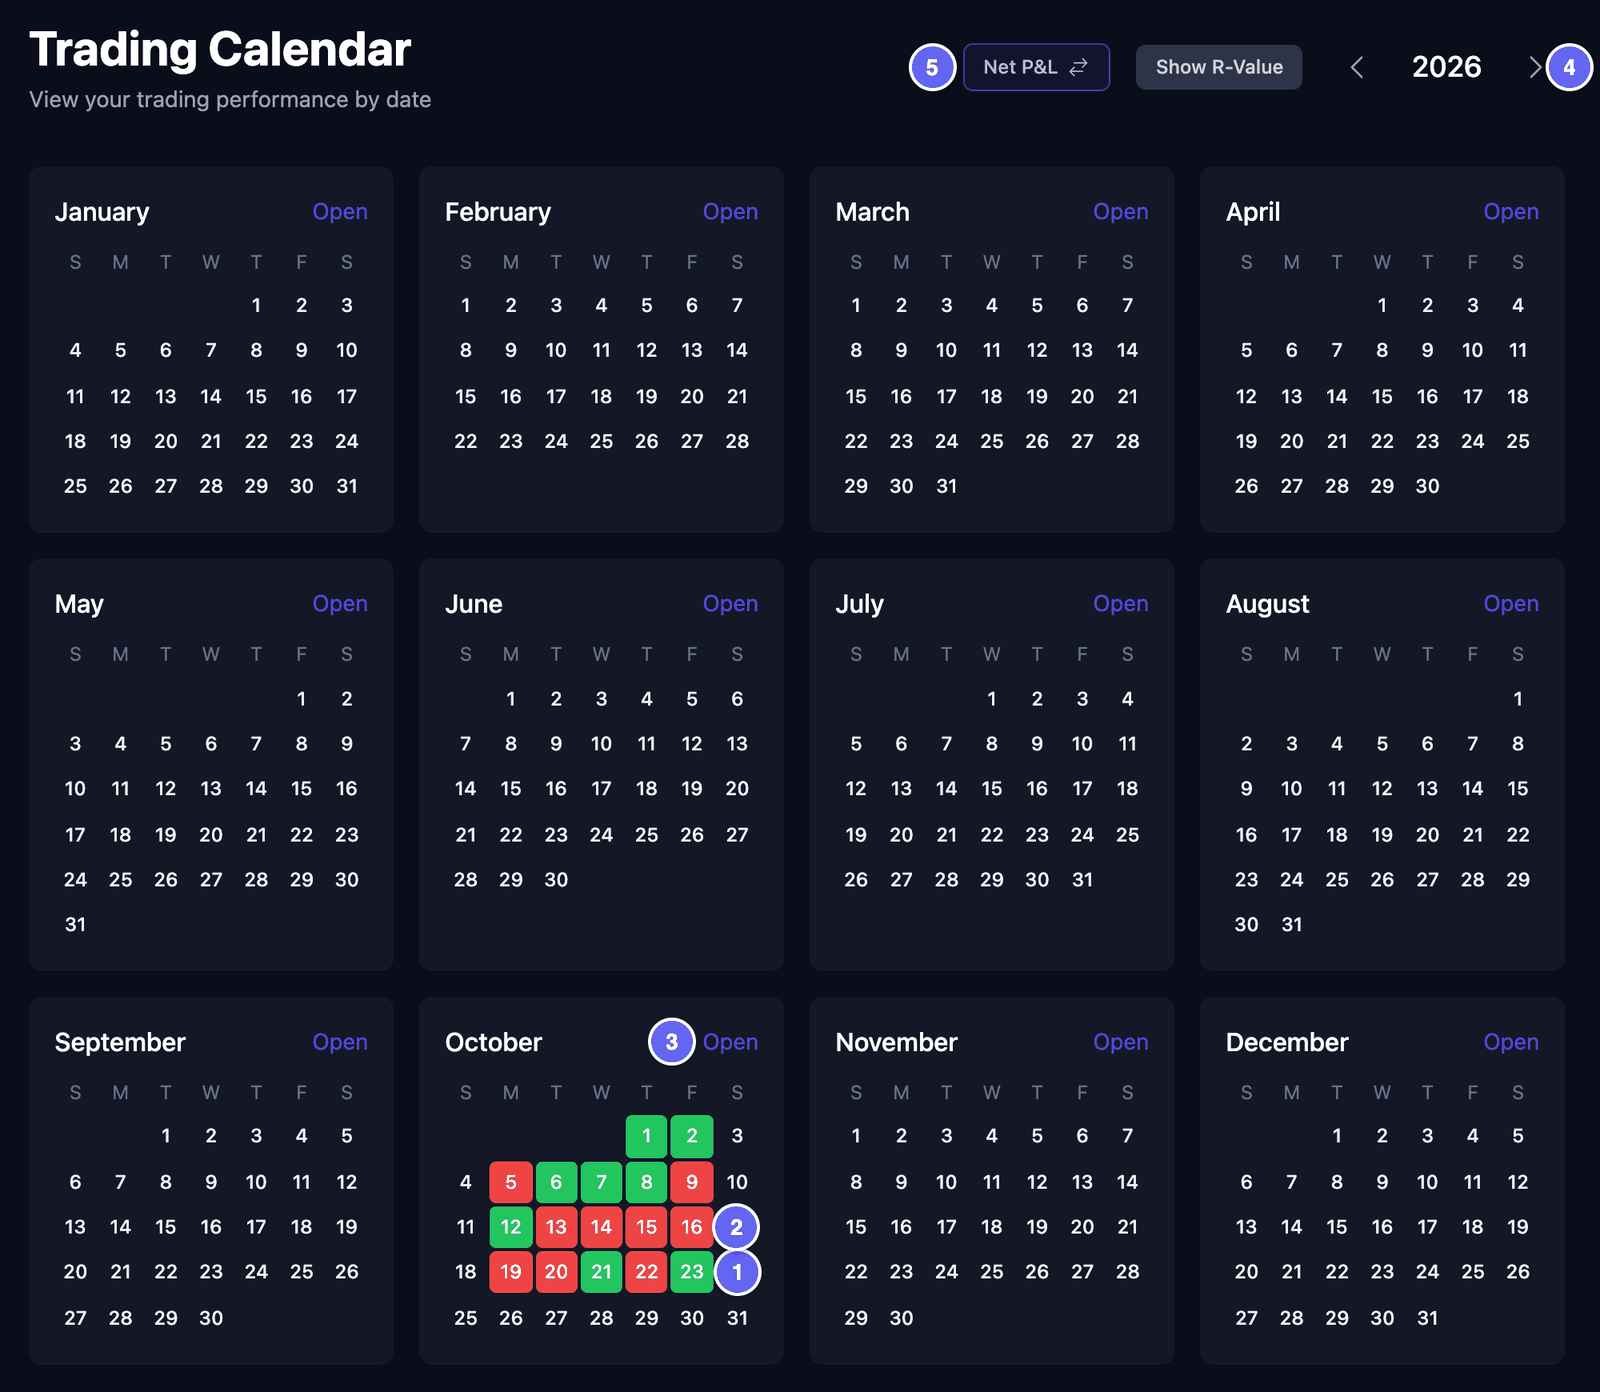
The Trading Calendar page shows a whole year. Each day you traded has a colour.
- In the menu, click Calendar.
- Look at the colours. Green means that day ended with a profit, or at zero. Red means it ended with a loss.
- To see another year, click the arrows beside the year.
- To see one month in large, click Open on that month.

In the large month, each day shows its result and its number of trades. The last column, Week Net P/L, adds up each week. The large month shows Monday to Friday only.
Above the days, three boxes show:
- the month's result;
- Avg Initial Risk — your average planned risk per trade, for trades with a stop loss;
- Year To Date — your result from January to that month.
The arrows beside the month's name move one month. Close hides the large month.
Two buttons at the top change the numbers:
- Net P&L — click it to switch to Gross P&L, the result before costs. Click again to go back.
- Show R-Value — shows results in R instead of money. R is explained in The numbers at the top. Click Show Net P&L ($) to go back.
The calendar follows the account picker in the menu.
See one day's trades
- Click Open on a month.
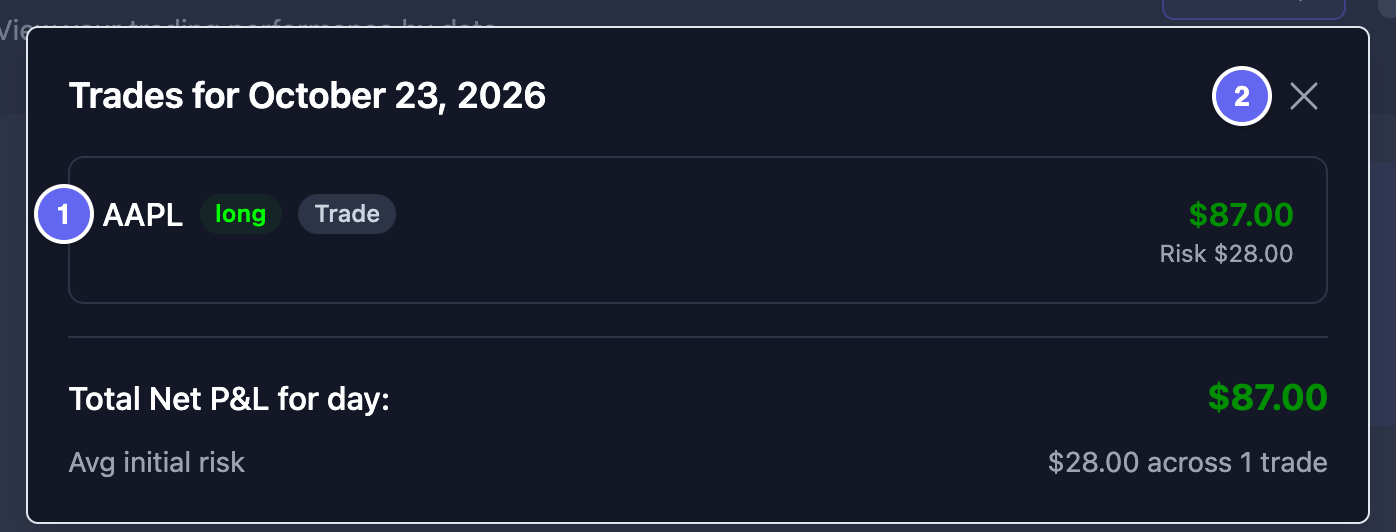
- In the large month, click a green or red day. A window lists that day's trades.
- Click a trade to open its page.
- Click the X to close the window.
At the bottom of the window, Total Net P&L for day: shows the day's result. In the twelve small months, a click on a day does nothing. Open the month first.